
Figure 5.
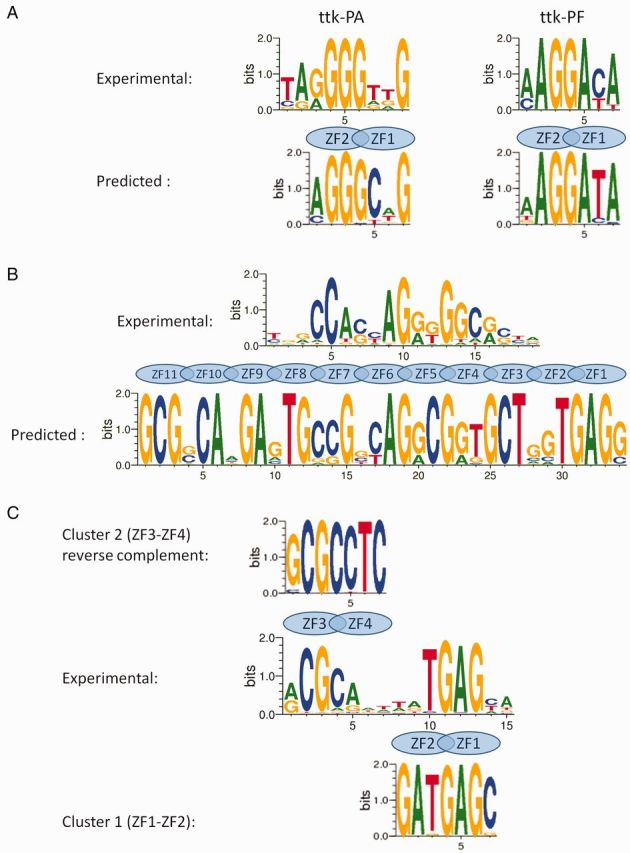
Comparison of experimental and SVM predicted sequence logos for (A) Tramtrack: experimental (top) and predicted by polynomial SVM (bottom); (B) CTCF: experimental (top) and predicted by expanded SVM (bottom); and (C) HER: predicted by expanded SVM for the ZF3-ZF4 array (top), experimental (middle) and predicted by expanded SVM for the ZF1-ZF2 array (bottom).