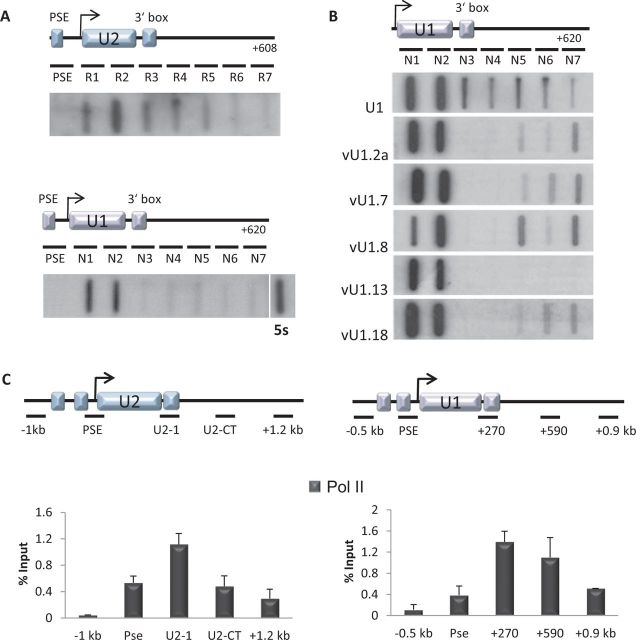
Figure 1.
Re-defining the U1 snRNA gene transcription unit. (A) Schematics of the U2 and U1 transcription units with the position of the NRO probes are indicated. The proximal sequence element, snRNA encoding and the 3′ box are denoted with blue (U2) and purple (U1) boxes; +608 (U2) and +620 (U1) correspond to the position of the last probe from the first base of the U2 and U1 snRNAs, respectively. The arrow represents the location of the start of transcription. Results of the in vivo NRO analysis of the U2 and U1 genes are shown below the schematics. (B) Schematic of the U1 snRNA gene labelled as in (A). Results of the NRO analysis with U1 and vU1 snRNA transcripts, generated in vitro, hybridized to filters containing probes complementary to the U1 snRNA transcript, as indicated, are shown below the schematic. (C) Schematics of the U2 and U1 snRNA genes, labelled as in (A), with the position of the ChIP probes indicated. Graphs represent results of pol II ChIP analysis of the U2 and U1 snRNA genes in HeLa cells with the position of the primers indicated below each graph. Error bars represent standard deviation of at least three independent experiments.

