
Figure 2.
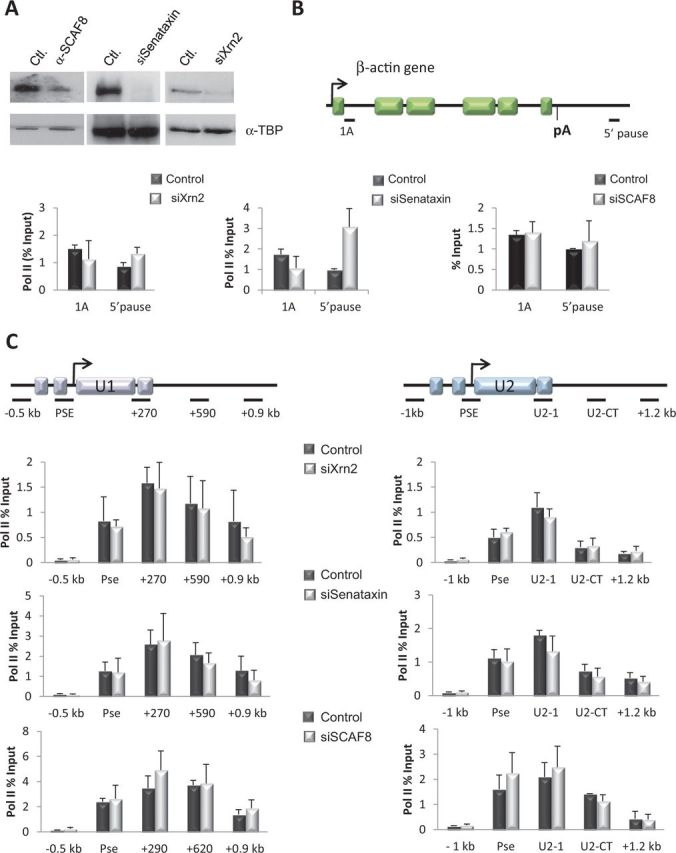
Human snRNA genes do not use an Nrd1-like pathway to terminate transcription in vivo. (A) Western blot analysis of HeLa whole-cell extracts from control cells or cells transfected with an siRNA specific for SCAF8, senataxin and Xrn2. Antibodies used for detection were α-SCAF8 (left), α-Senataxin (middle) and α-Xrn2 (right). α-TATA-binding protein was used as a control for protein levels. (B) Schematic of the β-actin gene with the location of the primers used in ChIP assays indicated. The 5′ pause is described in (39). The arrow represents the TSS, exons are denoted by boxes and the position of the poly A site (pA) is indicated by a vertical line. Graphs represent results of pol II ChIP analysis before and after siRNA-mediated knockdown of Xrn2 (left graph), Senataxin (middle graph) and SCAF8 (right graph). (C) Schematics of the U1 and U2 snRNA genes are labelled as in Figure 1. Graphs represent results of pol II ChIP analysis of the U1 (left panel) and U2 (right panel) snRNA genes before and after siRNA-mediated knockdown of Xrn2 (top), Senataxin (middle) and SCAF8 (bottom). Levels of pol II quantitated in (A) and (B), in control and knockdown cells, are normalized to levels quantitated on a non-transcribed region of the genome (120 bp region ∼2 kb upstream of the U2 snRNA gene). Error bars represent standard deviation of at least three independent experiments.