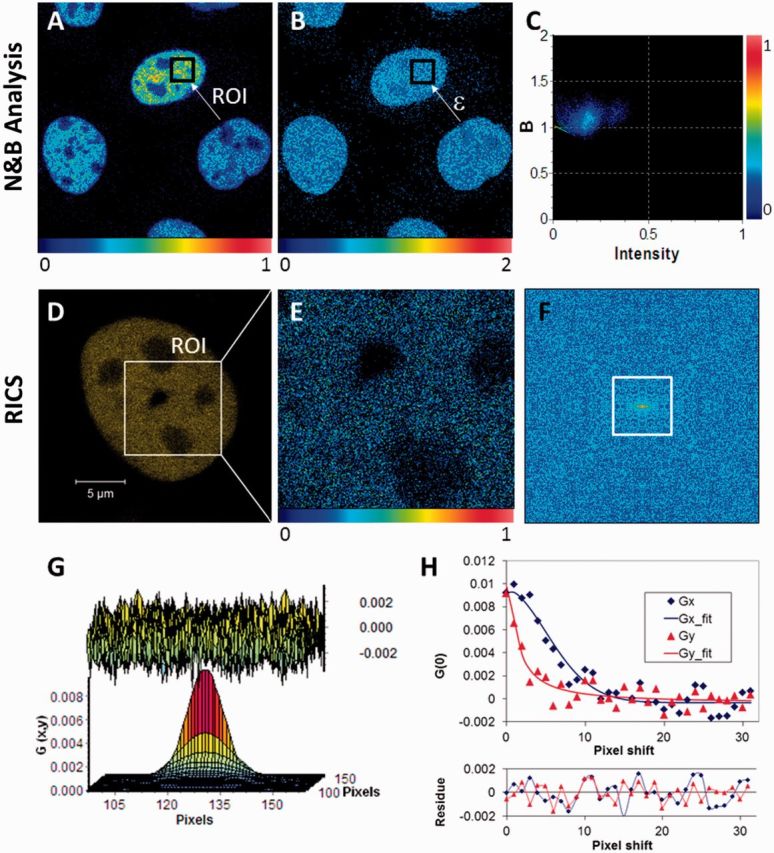
Figure 1.

Pictorial description of the N&B analysis and RICS methods. (A) Relative fluorescence intensity (scale 0–1) image of Xrs6 cells expressing GFP-Ku80. The inset (arrow) indicates a typical user-selected ROI, the time series intensity data of which is processed by Equation 1 to determine the molecular number (n). (B) The molecular brightness (ε) map, obtained after processing the image in (A) with Equation 2, indicating an even distribution of molecular brightness throughout the nucleus despite differences in protein concentration between cells as seen in (A). These brightness values [B (scale 0–2)] can be converted to photon counts per molecule per second by calculating (B − 1)/(pixel dwell time). (C) The 2D histogram of (B) versus intensity for the ROI shown in (A) and (B). The spread of the points indicates pixel variance, which shows a predominantly unimodal distribution. (D) Confocal image of a V3 cell expressing YFP-DNA-PKcs with the inset showing a region of the nucleus selected for RICS measurement. (E) Snapshot of the time-averaged fluorescence intensity image of the selected ROI on which RICS analysis was then to be applied (relative intensity scale 0–1). (F) Image of the 2D RICS data (256 × 256 pixels) obtained after applying Equation 5. (G) Fitting of the 2D RICS data (64 × 64 pixels) obtained from inset in (F) using Equation 6 (top, the fit residuals). (H) Simultaneous plot of 1D cross-sections of the 2D RICS data along the x and y directions along with corresponding fit data (bottom, the fit residuals). The data extend for 32 pixels along each direction as indicated by the white square in (F).
