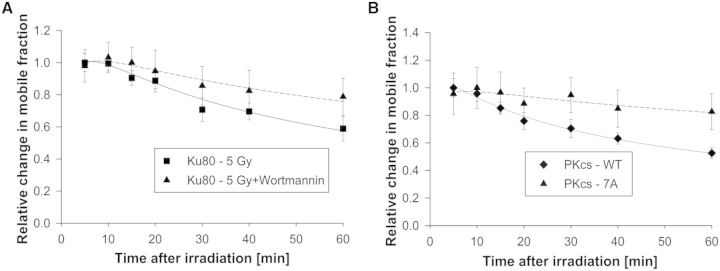
Figure 5.

Quantification of GFP-Ku80 and YFP-DNA-PKcs kinetics by N&B analysis under repair-inhibited conditions. (A) Change in GFP-Ku80 relative mobile fraction as a function of time post-irradiation for Xrs6 cells irradiated with 5 Gy (squares) and for the same cells irradiated with the same dose after exposure to Wortmannin (triangles). The error bars represent the standard error to the mean calculated from 10 different cells. (B) Change in relative mobile fraction of wild-type (WT) YFP-DNA-PKcs as a function of time post-irradiation for V3 cells irradiated with 1 Gy and corresponding kinetics for the 7A-DNA-PKcs phosphorylation mutant for the same dose.
