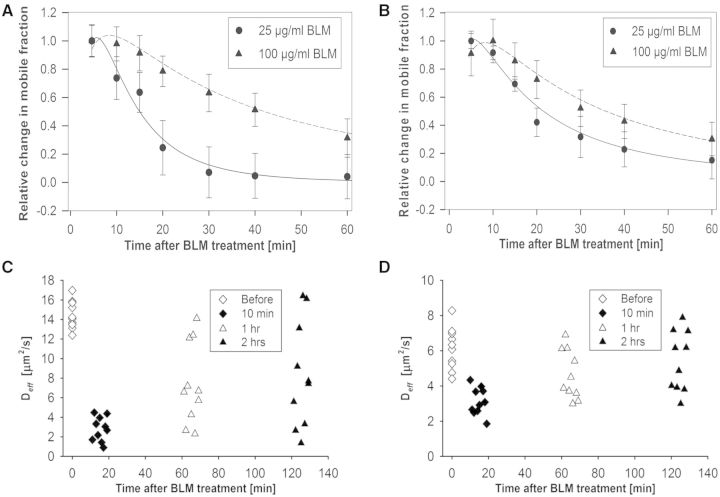
Figure 6.
Quantification of GFP-ku80 and YFP-DNA-PKcs kinetics by N&B analysis and RICS after bleomycin treatment. (A) Change in GFP-Ku80 relative mobile fraction as a function of time inside the nucleus of Xrs6 cells that were treated with different bleomycin doses (25 μg/ml: circles, 100 μg/ml: triangles). (B) Change in YFP-DNA-PKcs relative mobile fraction as a function of time inside the nucleus of V3 cells that were treated with different bleomycin doses (25 μg/ml: circles, 100 μg/ml: triangles). The error bars in both top panels represent the standard error to the mean calculated from 10 different cells. (C) Variation of Deff for GFP-Ku80 as a function of time after bleomycin treatment; the average value was 14.57 ± 1.41 μm2/s before treatment, 2.17 ± 1.58 μm2/s at 10 min, 7.75 ± 4.35 μm2/s at 1 h and 9.02 ± 5.78 μm2/s at 2 h post-treatment. (D) Variation of Deff for YFP-DNA-PKcs as a function of time after bleomycin treatment; the average value was 6.13 ± 1.19 μm2/s before bleomycin treatment, 3.13 ± 0.78 μm2/s at 10 min, 4.64 ± 1.38 μm2/s at 1 h and 5.41 ± 1.71 μm2/s at 2 h post-treatment.

