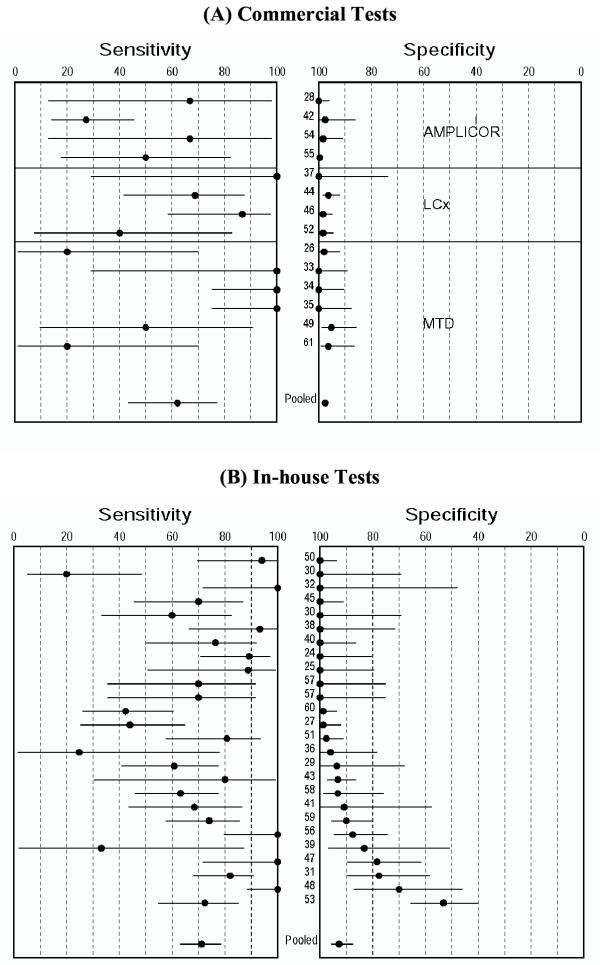
Figure 2.

Forest plots of estimates of sensitivity and specificity in studies with commercial and in-house tests. The point estimates of sensitivity and specificity from each study are shown as solid circles. Error bars are 95% confidence intervals. Numbers indicate the studies cited in the bibliography. Pooled estimates are summary random effects estimates with 95% confidence intervals.
