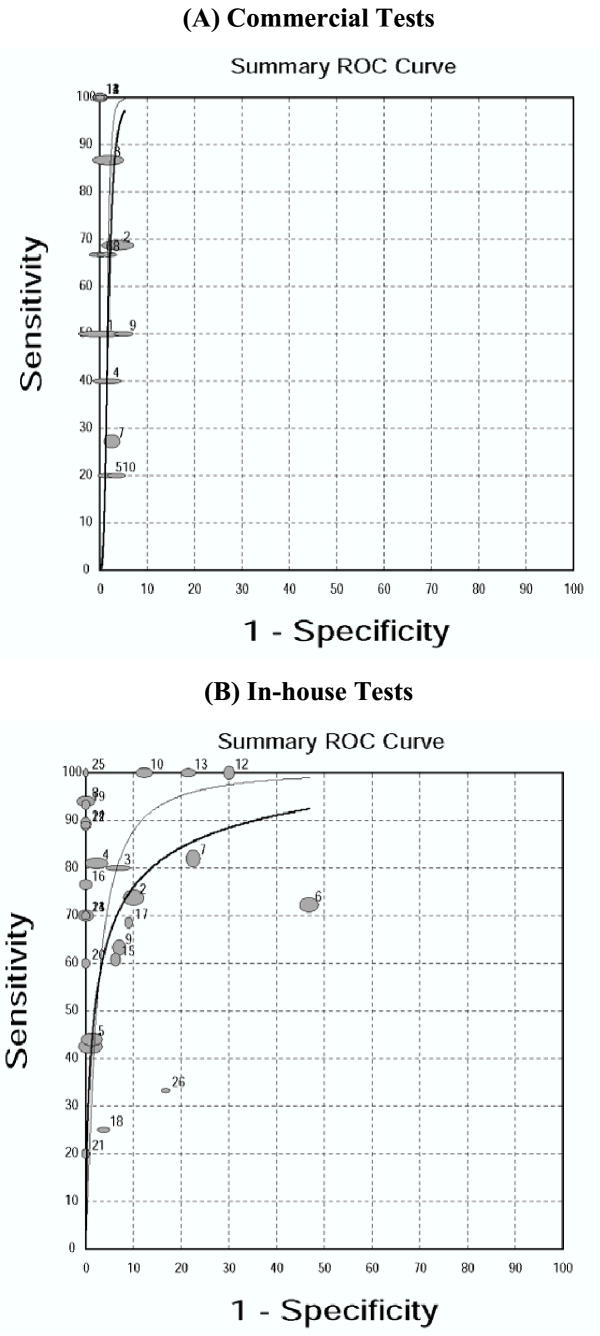
Figure 3.

Summary Receiver Operating Characteristic curves for commercial and in-house tests Each solid circle represents each study in the meta-analysis. The size of each study is indicated by the size of the solid circle. The weighted (dark line) and unweighted (thin line) regression SROC curves summarize the overall diagnostic accuracy.
