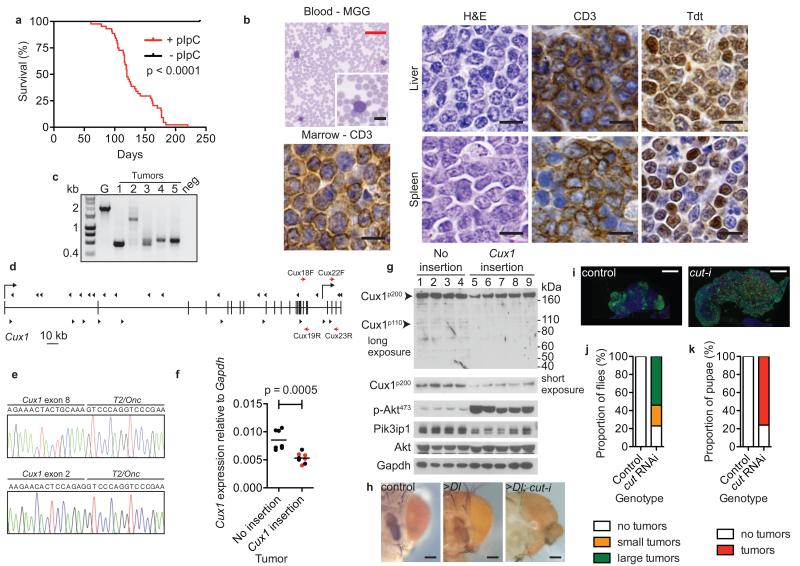
Figure 2. Identification of CUX1 as a tumor suppressor gene in mice and Drosophila.
(a) Kaplan-Meier survival curve of T2/Onc; SB11; Mx1-Cre transgenic mice injected with pIpC (red line, n = 44) or sham controls (black line, n = 7). Increased mortality in pIpC-injected mice (median survival 120 days; p < 0.0001, log-rank test).
(b) T-ALL phenotype of mouse transposon tumors. Blood smear stained with May-Grünwald-Giemsa (MGG). Liver and spleen sections stained with haematoxylin/eosin (H&E) showing blast cells. Immunohistochemistry performed on liver and spleen tissues to detect CD3 and Tdt (Terminal deoxynucleotidyl transferase) antigens. Bone marrow immunostaining showing infiltration with CD3+ T cells. Scale bars; black = 10 μm, red 50 μm.
(c) TCRβ gene rearrangements in transposon tumors by PCR analysis. ~2-kb germline (G) product obtained using wild-type mouse tail DNA. Smaller bands in mouse tumors 1-5 indicative of TCRβ gene rearrangement; neg, no DNA.
(d) Distribution of transposon insertions (arrowheads) across Cux1 locus. Vertical bars, exons. Direction of Cux1 transcription is left-to-right. Transcriptional start sites for Cux1p200 and Cux1p75 are shown by right-angled arrows from exon 1 and intron 20 respectively. Direction of arrowheads indicates orientation of transposon insertion with respect to MSCV promoter. Red arrows show location of primer pairs used for qRT-PCR: Cux18F-Cux19R, nucleotides 2884-2998; Cux22F-Cux23R, nucleotides 3484-3671 with respect to Cux1 transcript ENSMUST00000176172.
(e) Detection of splicing from Cux1 exons 8 and 2 to T2/Onc transposon by RT-PCR from two tumors, predicted to truncate the Cux1 transcript.
(f) Reduction in Cux1 levels in mouse transposon thymic tumors with Cux1 insertions by qRT-PCR using Cux18F-Cux19R primers that detect Cux1p200 and Cux1p110 transcripts. Data points are mean of triplicate assessments. Bar, mean of each group; p = 0.0005, t-test. Red, tumors with two Cux1 insertions.
(g) Immunoblot showing levels of indicated proteins in transposon tumors with and without Cux1 insertions.
(h) Knockdown of cut enhances overgrowth phenotype caused by Delta overexpression. Control showing normal adult eyes (ey-Gal4 UAS-GFP, UAS-GFPRNAi), slightly enlarged eyes caused by Delta overexpression (>Dl) (ey-Gal4 UAS-Dl, UAS-GFPRNAi) and dramatically altered eyes caused by Delta overexpression combined with cut-knockdown (>Dl; cut-i) (ey-Gal4 UAS-Dl, UAS-cutRNAi). Scale bar = 100 μm.
(i) Hyperplasia caused by ablation of cut in blood cell lineage. Differentiating blood cells (marked by pxn-Gal4 UAS-GFP) are restricted to the cortex in control lymph glands but are greatly expanded in the presence of cut RNAi (pxn-Gal4 UAS-GFP UAS-cutRNAi) causing overgrowth of the whole gland. Red, differentiating crystal cells; blue, nuclei labelled with DAPI. Scale bar = 50 μm.
(j, k) Percentage of adult females (j) and pupae (k) exhibiting visible melanotic tumors in control (pxn-Gal4 UAS-GFP UAS-white RNAi) (n = 70 and 31 respectively) and cut knockdown (pxn-Gal4 UAS-GFP UAS-cutRNAi) (n = 74 and 46 respectively) genotypes.

