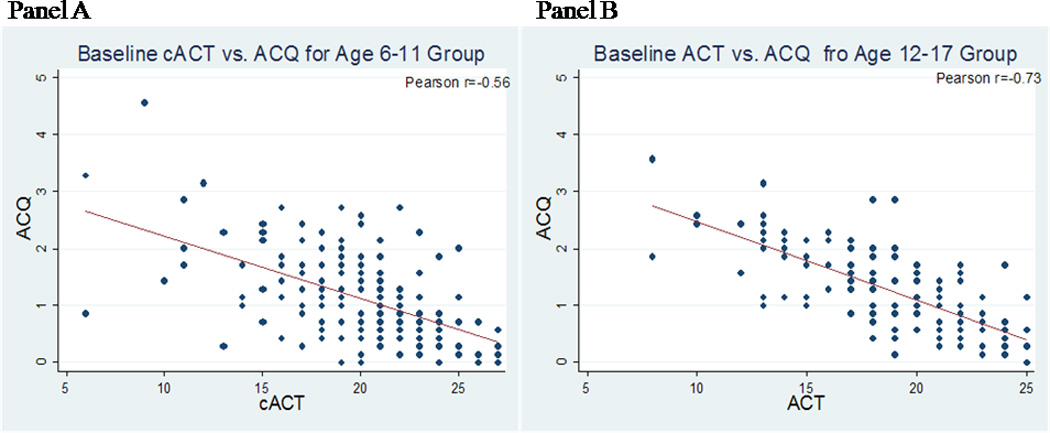
Figure I.

A and B. Scatter plots, regression line, and Pearson correlation coefficient for the ACQ and cACT (age 6 to 11), Panel A, with equation of y(ACQ) = 3.31−0.11x(cACT), or ACT (age 12 to 17), Panel B, with equation of y(ACQ) = 3.82−0.14x(ACT).
