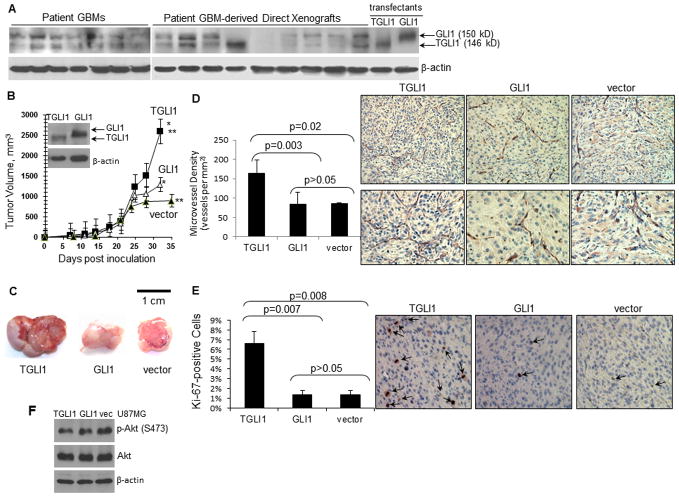
Figure 1. TGLI1 is highly expressed in GBM and enhances in vivo growth and vascularity of GBM xenografts.
A, TGLI1 protein was detected in patient GBMs sand direct xenografts. Resolution of TGLI1 and GLI1 proteins was enabled via prolonged 5.5% SDS-PAGE and WB with a GLI1 antibody. Stable GBM cells with TGLI1 and GLI1 were used to indicate the two GLI1 isoforms.
B, TGLI1-expressing GBM xenografts were significantly more aggressive in growth than the control and those with GLI1 (*,**, p<0.05). N=6 per group. Student t-test was conducted to determine p-values.
C, TGLI1-carrying GBM xenografts were highly vascularized. Three representative GBM xenografts are shown.
D, TGLI1-expressing xenografts contained significantly more blood vessels that those with GLI1. IHC was conducted to detect CD31 and derive microvessel density using a standard method [22, 25]. Student t-test was conducted to determine p-values. Right lower panels show high-resolution images.
E, TGLI1-expressing tumors were more proliferative than control and those with GLI1. IHC was conducted to detect Ki-67. Student t-test was used to determine p-values. Representative Ki-67-stained xenografts are shown in the right panels. Arrows point to brown Ki-67-positive tumor nuclei.
F, No significant difference in Akt activation status was observed among the three U87MG lines, as indicated by western blotting.

