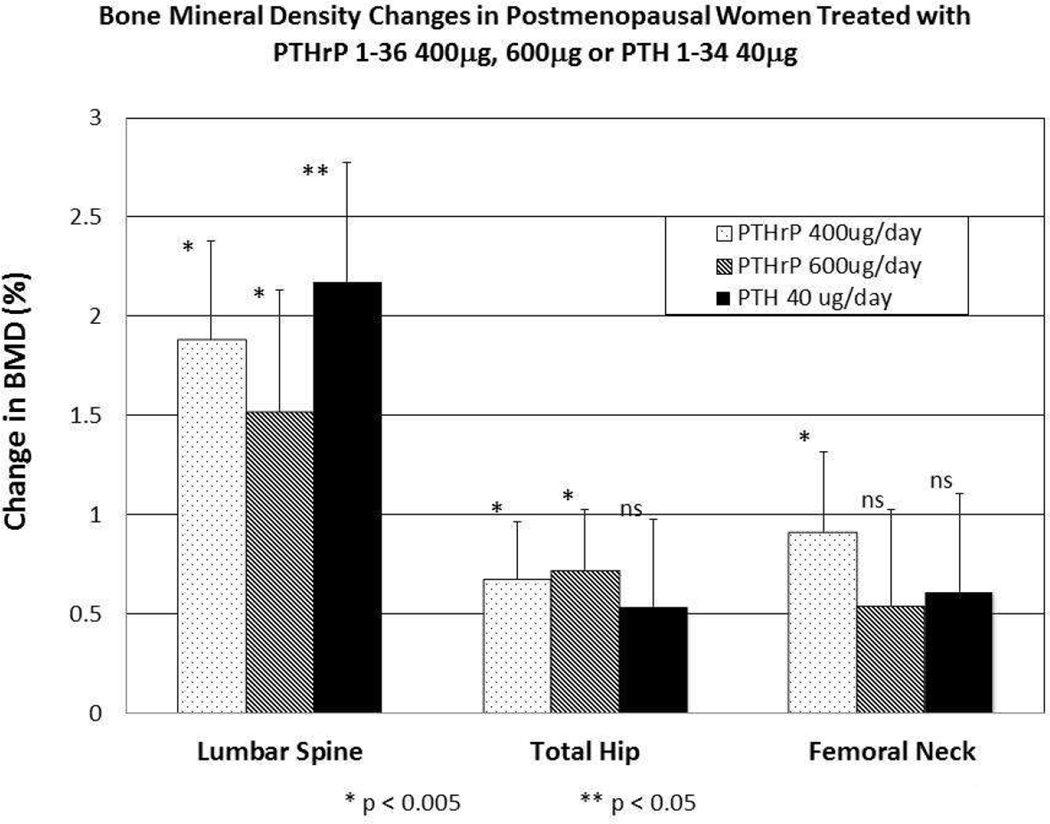
Figure 1.
Lumbar Spine and Hip Bone Mineral Density Changes in Postmenopausal Women Treated with PTHrP 1-36 400µg, 600µg or PTH 1-34 40µg.
The three groups are indicated by the patterns shown in the legend within the figure. There was no significant difference in BMD change between groups at any site. Bars indicate SEM, and the * and ** symbols refer to statistical significance compared to baseline values. Lumbar spine BMD increased equivalently and significantly by day 90 in all three groups. Total hip and femoral neck BMD increased equivalently in all three groups, but was significant only for the two PTHrP(1-36) groups (p–0.05 vs baseline) at the total hip, and for the PTHrP(1-36) 400μg group at the femoral neck (p–0.05 vs baseline). Results are presented as percent change from baseline.
Modified with permission from the American Society for Bone and Mineral Research [28].

