
Figure 6.
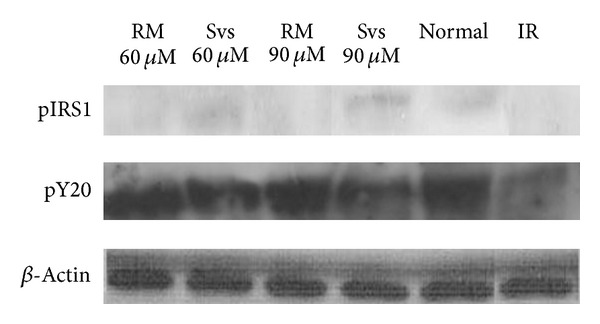
Band intensities observed via Western blotting, showing the different expression levels of phosphorylated insulin receptor substrate 1 (p-IRS1) and phosphorylated tyrosine (pY20), in groups treated with stevioside (Svs) and rosiglitazone maleate (RM) in comparison to the normal and insulin-resistant (IR) groups. β-actin was used as a loading control. The experiment was repeated thrice.