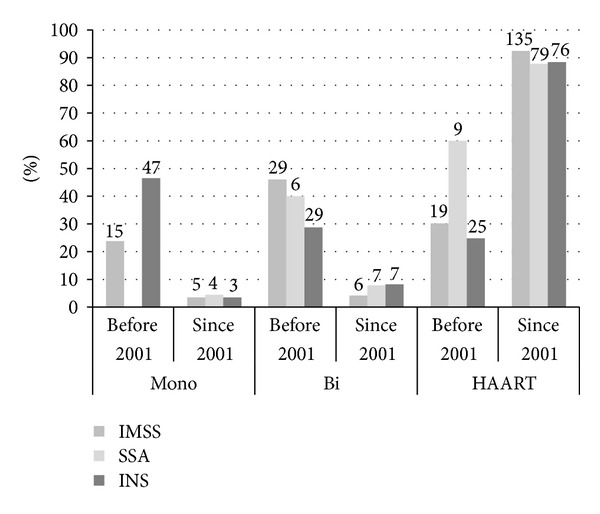
Figure 3.

Distribution of patients by health subsystem and the type of initial ARVT. *Percentages were calculated with respect to the number of patients initiating therapy by period in each facility. IMSS information was available from 1993, SSA from 1999, and INS from 1990. The number over each bar is the total number of patients by category.
