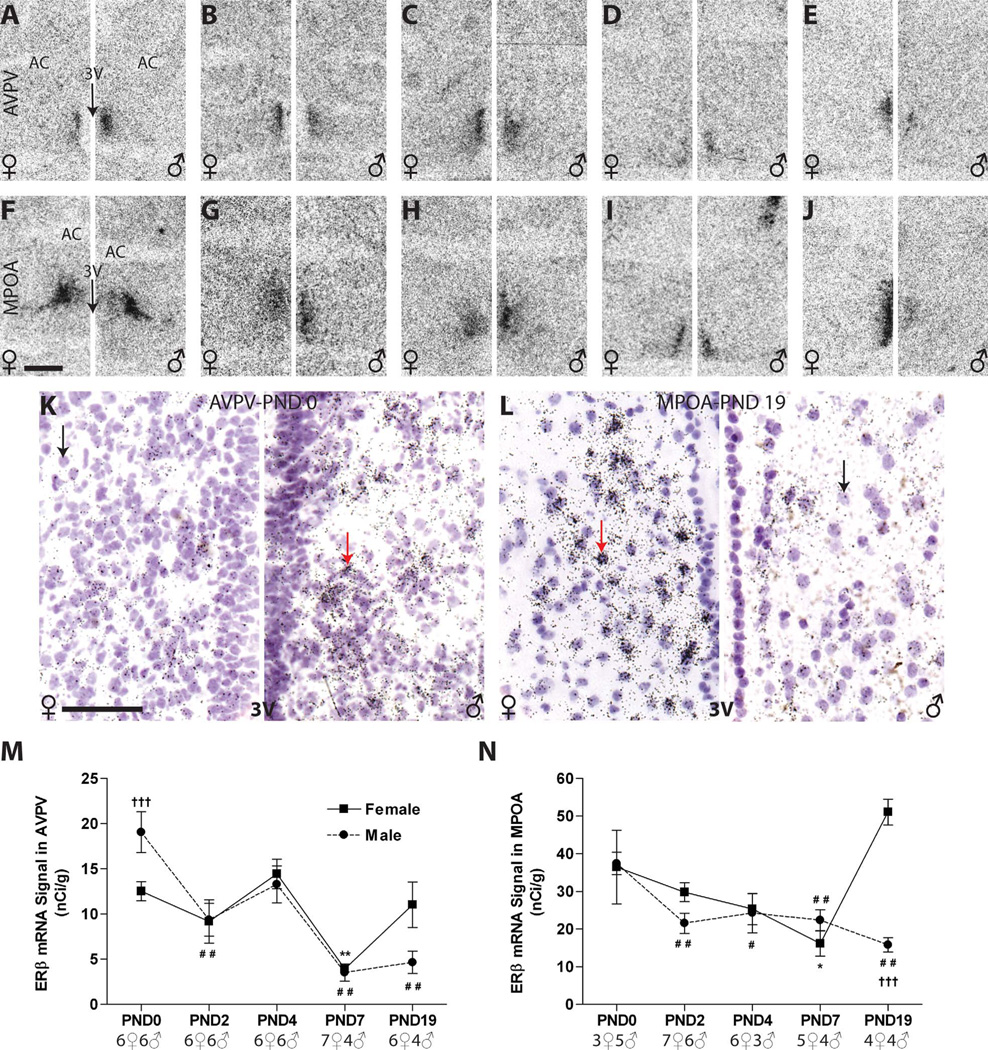
Figure 6.
A–J: Autoradiographs showing ERβ mRNA expression in the RP3V of male and female neonatal rats (females on the left side of each panel, males on the right). Signal was relatively weak at all ages examined but distinguishable from background and quantifiable by optical density in the AVPV (A–E) and MPOA (F–J). The pattern of autoradiographic labeling was confirmed by observing silver grain deposition on the emulsion-dipped, counterstained slides. K,L: Label appeared as tight clusters (gray arrows) over the counterstained nuclei (black arrows). ERβ expression was sexually dimorphic at birth in the AVPV (A,K,M) with males (right panel of A,K) having significantly higher expression levels than females (left panel of A,K). This sex difference was rapidly lost, and no sex difference was observed until PND 19 (M,N), at which point females had significantly more ERβ signal than males in the MPOA (J,L), but only a trend for a difference was observed in the AVPV (E; P = 0.09). M,N: In both sexes, ERβ expression was notably lower on PND 7, compared with PND 0, but levels recovered in both regions by PND 19 in females. For the females, significant differences in temporal expression levels are represented by (*) P ≤ 0.05 and (**) P ≤ 0.01, compared with PND 0. For the males, significant differences in expression from PND 0 are indicated by (#) P ≤ 0.05 and (###) P ≤ 0.01. Significant sex differences are represented by (†) P ≤ 0.05, (††) P ≤ 0.01, and (†††) P ≤ 0.001. The sample size for each age is indicated on the graphs, and the data points represent mean ± SEM. For abbreviations, see list. Scale bar = 500 µm in F (applies to A–J); 50 µm in K (applies toK,L). [Color figure can be viewed in the online issue, which is available at wileyonlinelibrary.com.]

