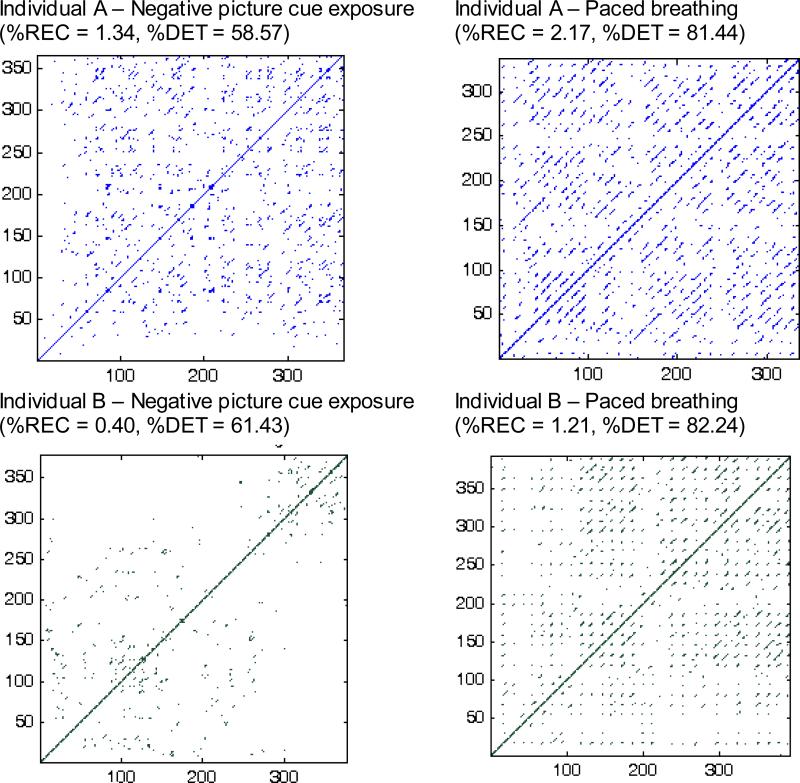
Figure 4.
Recurrence plots of the R-R interval (RRI) data shown in Figure 3. For individual A, the data were plotted with a delay parameter of 1, embedding dimension parameters of 3 (paced breathing) and 4, and radius parameters of 4% (paced breathing) and 5%: (a) negative picture cue exposure, and (b) paced breathing. For individual B, the data were plotted with a delay parameter of 1, embedding dimension parameters of 4 and 5 (paced breathing), and a radius of 4%: (c) negative picture cue exposure, and (d) paced breathing.

