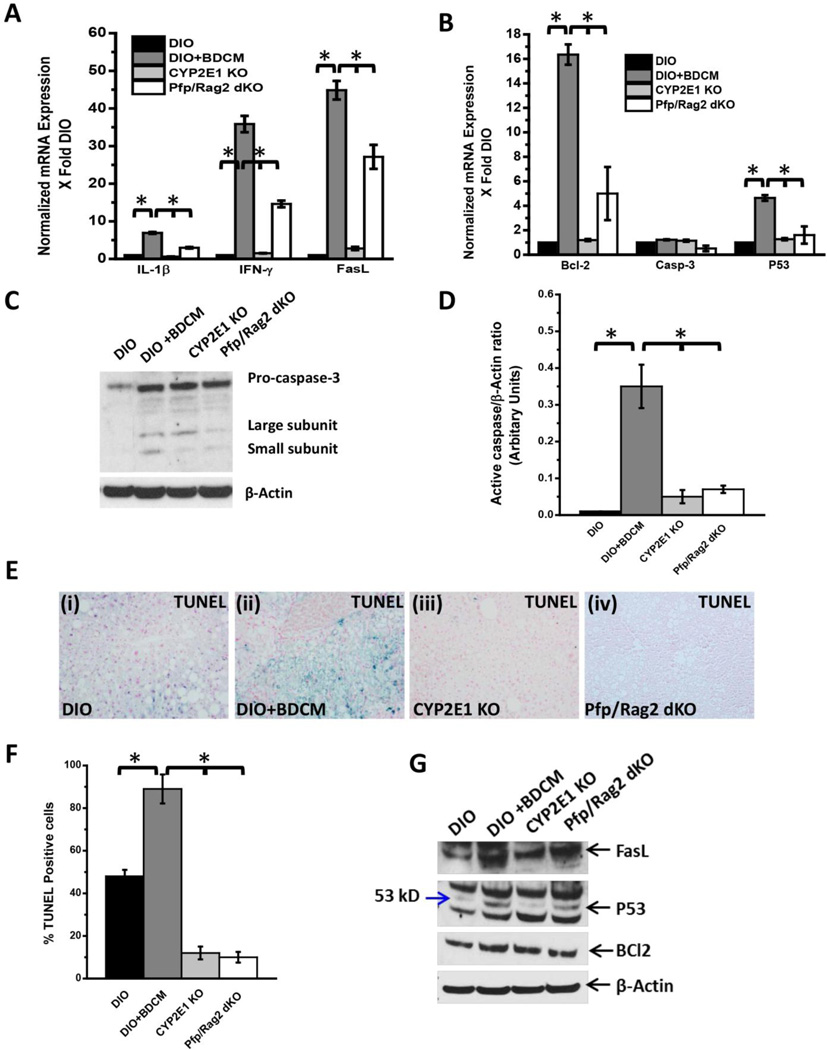
Fig.3.
A. mRNA expressions of IL-1β, IFN-γ and FasL from liver homogenates of dietinduced obese mouse (DIO), diet-induced obese mouse exposed to bromodichloromethane (DIO+BDCM), diet-induced obese mouse with CYP2E1 gene deletion and exposed to bromodichloromethane (CYP2E1 KO), and diet-induced obese mouse with Pfp/Rag2 dual gene deletion and exposed to bromodichloromethane (Pfp/Rag2 dKO). mRNA expressions had been assessed by quantitative real-time PCR (qRTPCR) and expressions in DIO+BDCM, CYP2E1 KO and Pfp/Rag2 dKO groups were normalized against mRNA expression in DIO group (* P<0.05). B. mRNA expressions of Bcl-2, Caspase-3 (Casp-3) and P53 from liver homogenates of DIO, DIO+BDCM, CYP2E1 KO and Pfp/Rag2 dKO groups. mRNA expressions had been assessed by qRTPCR and expressions in DIO+BDCM, CYP2E1 KO and Pfp/Rag2 dKO groups were normalized against mRNA expression in DIO group (* P<0.05). C. Western Blot analysis of pro-caspase-3 and active-caspase-3 (large and small subunits) protein expression levels in liver homogenates from DIO, DIO+BDCM, CYP2E1 KO and Pfp/Rag2 dKO groups. The corresponding β-actin levels are shown in the lower panel. D. Band quantification analysis (arbitrary units) of active-caspase-3 (ratio to β-actin) from DIO, DIO+BDCM, CYP2E1 KO and Pfp/Rag2 dKO groups (bands shown in fig. 3C). E (i)–(iv). Number of apoptotic nuclei as shown by TUNEL staining in liver slices from DIO, DIO+BDCM, CYP2E1 KO and Pfp/Rag2 dKO groups respectively. Number of TUNEL positive cells identified by their blue-stained nuclei as against the nuclear fast red stained nuclei correspond to the number of apoptotic events. Images were taken in 20× magnification. F. Percentage of TUNEL positive cells (obtained by morphometry done on images from three separate microscopic fields) in DIO, DIO+BDCM, CYP2E1 KO and Pfp/Rag2 dKO groups (* P<0.05). Western blot analysis of apoptotic protein FasL, p53 and Bcl2 (From top down) from liver homogenates.

