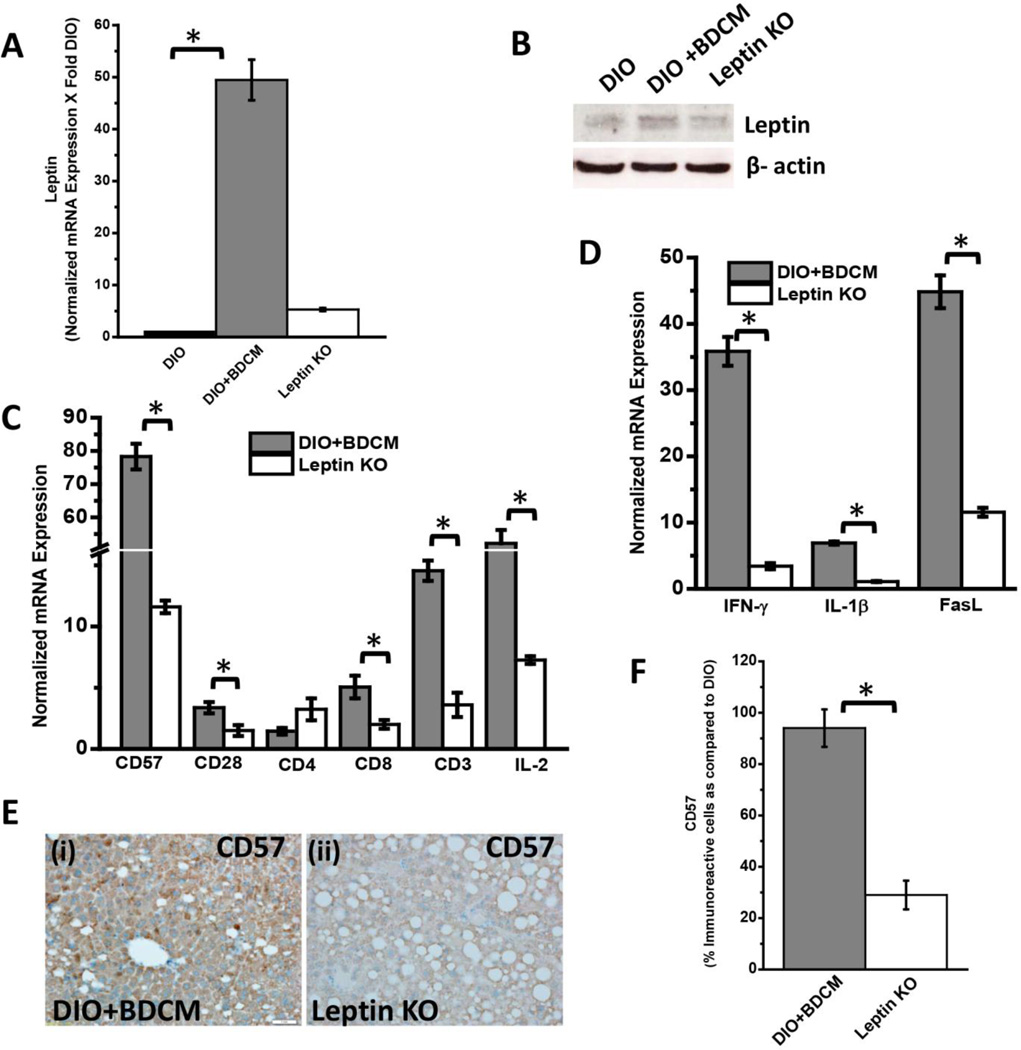
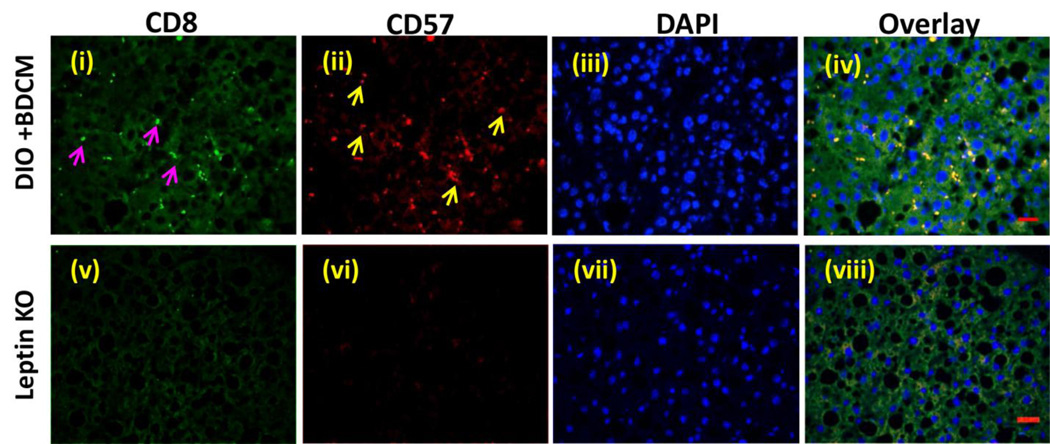
Fig.4.
A. mRNA expression of leptin from liver homogenates of diet-induced obese mouse (DIO), diet-induced obese mouse exposed to bromodichloromethane (DIO+BDCM) and diet-induced obese mouse with leptin gene deletion and exposed to bromodichloromethane (Leptin KO). mRNA expressions had been assessed by quantitative real-time PCR (qRTPCR) and expressions in DIO+BDCM and Leptin KO groups were normalized against mRNA expression in DIO group (* P<0.05). B. Western Blot analysis of leptin protein expression levels in liver homogenates from DIO, DIO+BDCM and Leptin KO groups. The corresponding β-actin levels are shown in the lower panel. C. mRNA expressions of CD57, CD28, CD4, CD8, CD3 and IL-2 from liver homogenates of DIO+BDCM and Leptin KO groups. mRNA expressions had been assessed by qRTPCR and expressions in DIO+BDCM and Leptin KO groups were normalized against mRNA expression in DIO group (* P<0.05). D. mRNA expressions of IFN-γ, IL-1β and FasL from liver homogenates of DIO+BDCM and Leptin KO groups. mRNA expressions had been assessed by qRTPCR and expressions in DIO+BDCM and Leptin KO groups were normalized against mRNA expression in DIO group (* P<0.05). E (i)–(ii). CD57 immunoreactivity as shown by immunohistochemistry in liver slices from DIO+BDCM and Leptin KO groups respectively. Images were taken in 20× magnification. F. Percentage of CD57 positive immunoreactive cells (obtained by morphometry done on images from three separate microscopic fields) in DIO+BDCM and Leptin KO groups compared to DIO group (* P<0.05). G. Immunofluorescence images for co-localization of CD57 (red) and CD8 (green) from liver sections of DIO+BDCM [(i)–(iv)] and Leptin KO[(v)–(viii)] groups. The images in the overlay panel on the extreme right depict co-localizations of CD57 and CD8 as revealed by the yellow regions. Images were taken in 40× magnification. The localizations of CD8 and CD57 are shown by pink and yellow arrows respectively.


