
Figure 4. Candidate Genes Directly Regulated by NPAS2 by Overlap of Npas2 -/- Gene Set with BMAL1 and CLOCK Gene Targets.
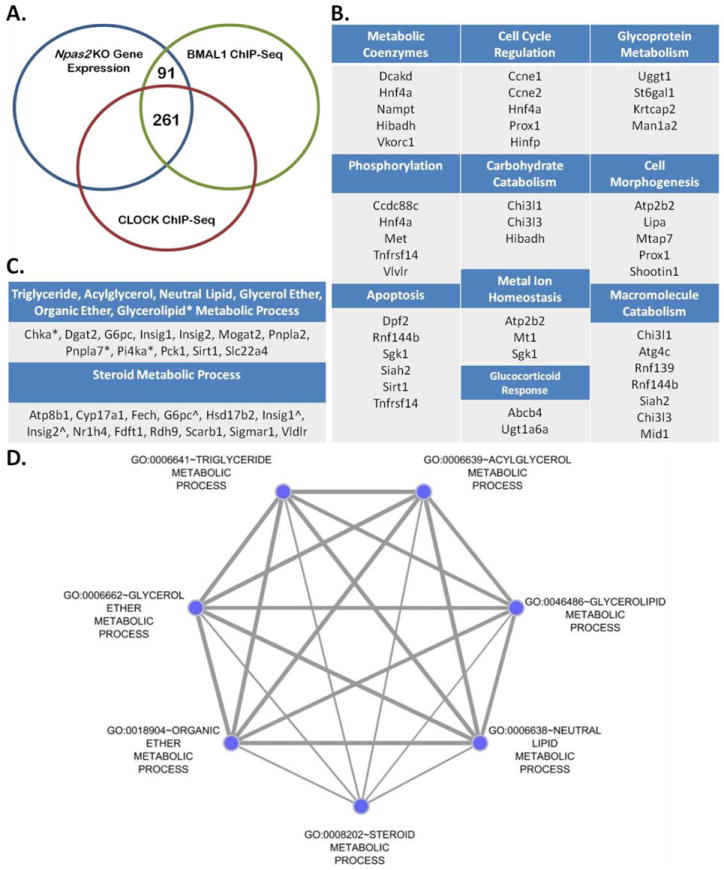
(A) Differentially expressed genes (3229) in Npas2 -/- liver (compared to +/+ control) (blue) compared with BMAL1 target genes (1997) from C57Bl/6 liver (green) (Rey et al., 2011) and CLOCK target genes (3201) from C57Bl/6J liver (red) (Koike et al., 2012). (B) 91 genes identified from BMAL1 ChIP-Seq, CLOCK ChIP-Seq and Npas2 -/- Exon Array overlap were analyzed by DAVID. 34 genes clustered into 10 GO terms. (C) List of genes represented in (D); * represents genes contained only in glycerolipid metabolic process GO term, ˆ represents genes shared by all seven GO terms. (D) Genes that intersected between BMAL1 and Npas2 -/- were analyzed using DAVID identifying seven GO terms. The graph was generated by visualizing the clustered GO terms using the Cytoscape Enrichment Map plugin, the edge thickness represents the overlaping genes between GO terms while the node size represents the number of genes found in each GO term.