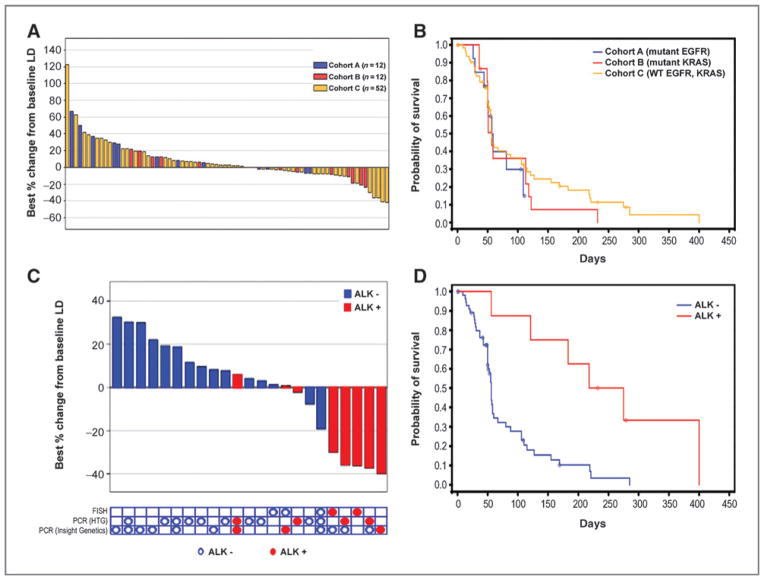
Figure 1.
Clinical activity with ganetespib. A, best response in all cohorts. B, Kaplan–Meier curve for PFS in each cohort. C, changes in tumor size in cohort C patients with (n = 8) and without (n = 15) ALK rearrangement. Of all patients in this cohort, the 23 shown had sufficient tissue for assessing ALK gene rearrangement status. D, Kaplan–Meier curve for PFS in patients with (n = 8) versus without (n = 15) ALK rearrangement.

