
Figure 1.
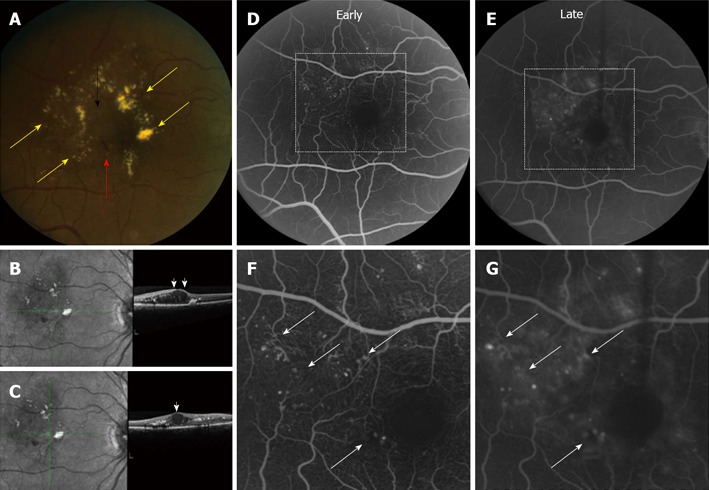
Fundus photo, optical coherence tomography, and fluorescein angiography of a patient with diabetic macular edema. A: Fundus photo demonstrating classic presentation of diabetic macular edema with lipid exudate (yellow arrows), retinal thickening (black arrow), and intraretinal hemorrhages (red arrow); B, C: Horizontal (above) and vertical (below) high-resolution line scan demonstrating the presence of intraretinal cysts (white arrowheads) in the inner retina; D, E: Fluorescein angiographic images demonstrating focal leakage arising from microaneurysms (white arrows); F, G: Diffuse leakage arising from the walls of capillaries.