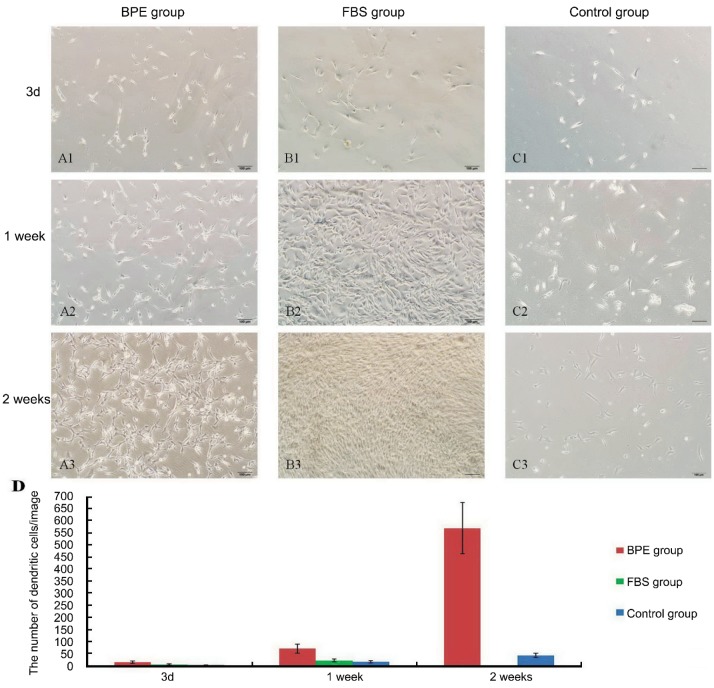
Figure 1. Morphologic changes in primary culture.
A1-A3. BPE group: A1. Many cells stretched out into branch-like shapes. A2. Most cells showed dendritic appearances. A3. By two weeks, networks were formed. B1-B3. FBS group: B1. Multiple morphological cells. B2. Transforming into fibroblast-shapes. B3. Fibroblast-like cells were with crosswise arraying. C1-C3. Control group: C1. On the third day, many cells were elongated. C2. Stretching out into branch-like or triangular shapes. C3. A few dendritic cells. D. The number of dendritic cells in three groups at different time points. The scale bar is 100µm in length.

