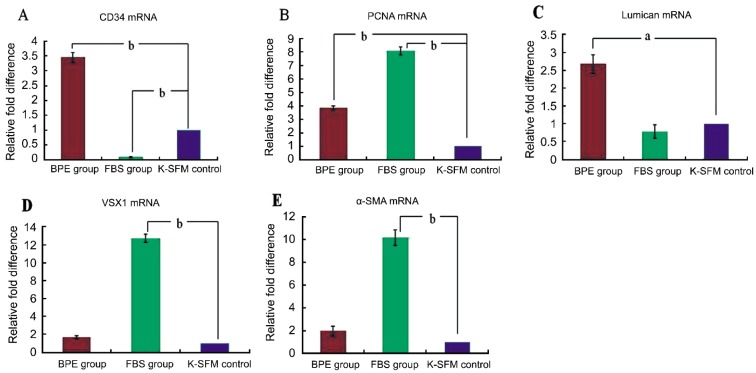
Figure 3. The relative differences in cytokine mRNA expression in primary culture.
Values are given relative to an increase or decrease from the control value in three groups (mean±SD) on the fourteenth day. aP<0.05 and bP<0.01versus the control group. A: CD34; B: PCNA; C: Lumican; D: VSX1; E: α-SMA.

