
Figure 4. Phenotype change in serial subcultivation.
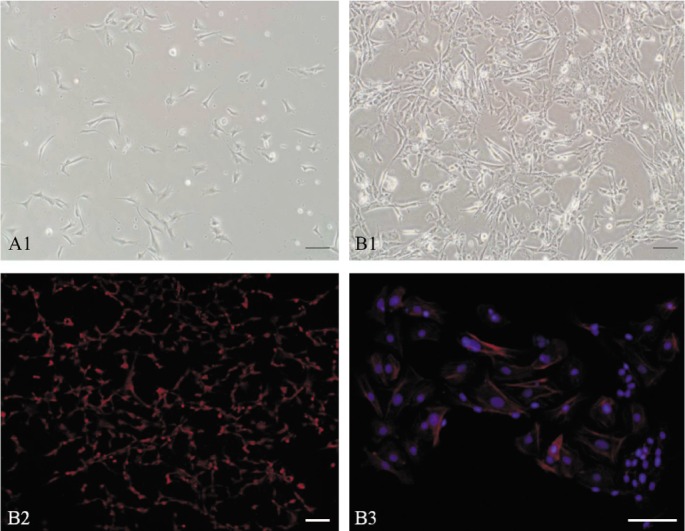
A and B1: Morphologic change. A: On the first day, cells spread out with a dendritic shape; B1: On the seventh day, networks were formed by the connection of their branches; B2: Immunofluorescent staining of CD34 (red); B3: The distribution of F-actins (red). The scale bar is 100 µm in length.