
Figure 3.
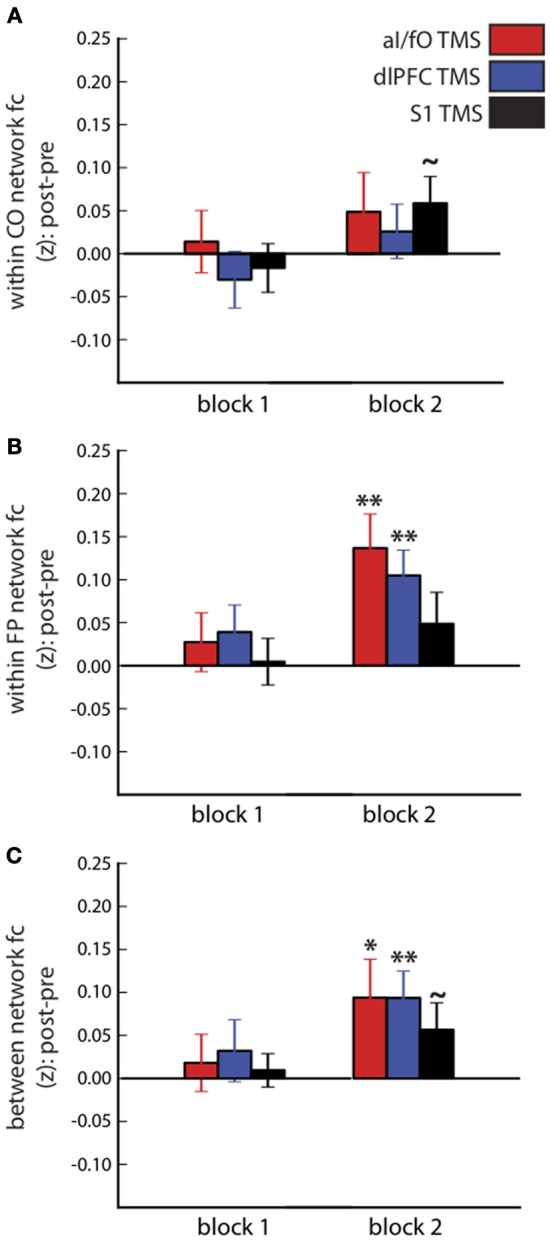
Connectivity within and between the CO and FP networks after TBS. Changes in connectivity after TBS (post-TBS Block 1 or 2 minus pre-TBS) are shown for the CO network (A), FP network (B), and between the two networks (C). Different sites of TBS (red, aI/fO; blue, dlPFC; black, S1) did not have systematically different effects on within- and between-network connectivity, although connectivity generally tended to increase after TBS (Post-TBS vs. Pre-TBS: **p < 0.01, *p < 0.05, ~p < 0.10).