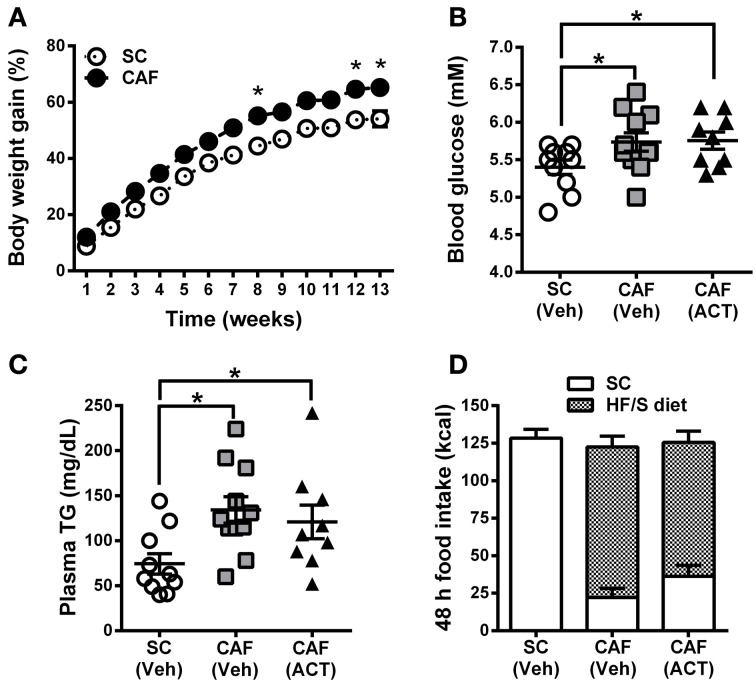
Figure 2.
Weight gain, MetS and food intake before treatment onset. (A) Time course of body weight gain over 13 weeks of SC and CAF diet feeding. Body weight gain is expressed as the percentage change from baseline body weight at the start of diet exposure. Mean ± s.e.m. (SC n = 10; CAF n = 20). *p < 0.05 vs. SC at the indicated time point by post-hoc test following ANOVA. Levels of whole blood glucose (B), and of plasma triglycerides (TG) (C) were analyzed in week 11 and 13, respectively. The group of 20 CAF diet fed rats was subdivided into one Veh (n = 11) and one ACT (n = 9) group which were going to start receiving treatment (Veh and ACT indicated in brackets) in week 14. Horizontal bars represent the mean ± s.e.m. *p < 0.05 by t-test. (D) Energy intake and food preference cumulated over 48 h before the start of Veh or ACT treatment. No snack was given during this 48 h period. All three groups consumed a similar amount of kcal. Both of the CAF diet fed groups preferred the HF/S diet over the SC and they did not differ statistically in their level of preference. Mean + s.e.m. (n = 9–11) per group. (SC, standard chow; CAF, cafeteria diet; HF/S, high fat/sweet; Veh, vehicle; ACT, ACT-335827).

