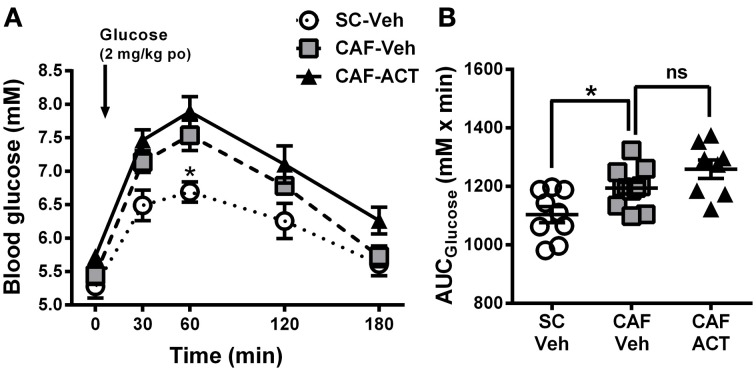
Figure 5.
Glucose homeostasis in week 17. (A) Oral glucose tolerance test (oGTT) performed on overnight fasted SC and CAF fed rats treated with Veh or ACT. Whole blood glucose was measured before (0 min) and at the indicated time points after the oral (po) administration of 2 mg/kg glucose (arrow). *p < 0.05 vs. CAF-Veh at the indicated time point by post-hoc test following ANOVA. Mean ± s.e.m. (n = 8–11) per group. Due to an incomplete blood sample set, data from one SC-Veh and one CAF-Veh rat had to be omitted because of repeated measures within subjects analyses. (B) AUC calculated individually for each rat. *p < 0.05 by t-test. The CAF-ACT group was statistically not different from the CAF-Veh group. (SC, standard chow; CAF, cafeteria diet; Veh, vehicle; ACT, ACT-335827; po, per os; AUC, area under the curve; ns, not significant).

