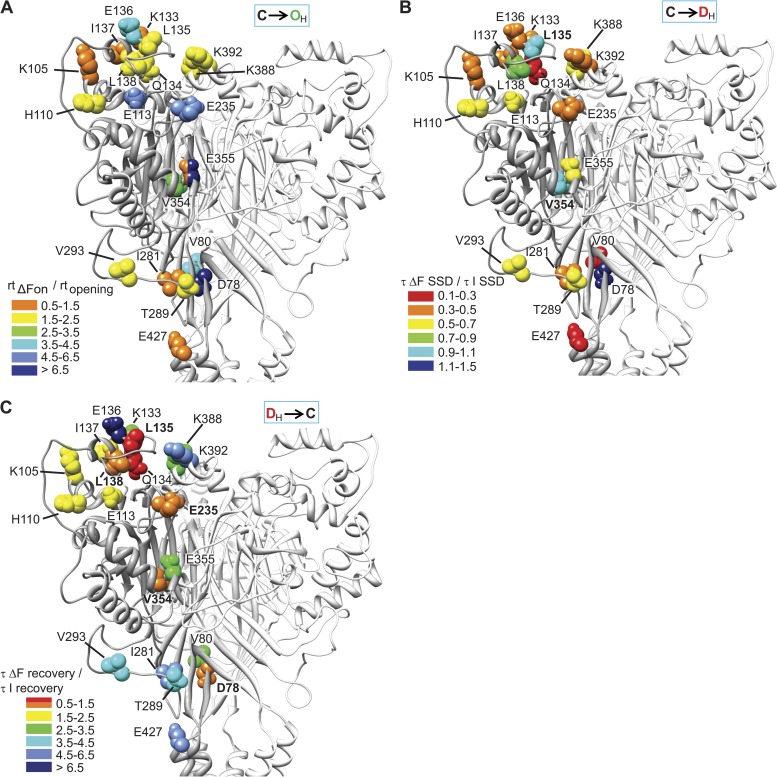
Figure 9.
Rearrangements during ASIC1a gating. (A) ΔF onset. Each residue is represented in the structural model with a color corresponding to the ratio of the rise time of the ΔF onset divided by the rise time of the current onset (rtΔFon/rtopening). From fast to slow, colors were orange, yellow, green, and the different shades of blue. (B) ΔF onset of SSD. Each residue is represented in the structural model with a color corresponding to the (τΔF(SSD)/τI(SSD)) ratio. Residues whose ΔF is associated with current SSD are labeled in bold. (C) Recovery of ΔF. Each residue is represented in the structural model with a color corresponding to the (τΔFrecovery/τIrecovery) ratio. Residues whose ΔF is associated with current recovery are labeled in bold.

