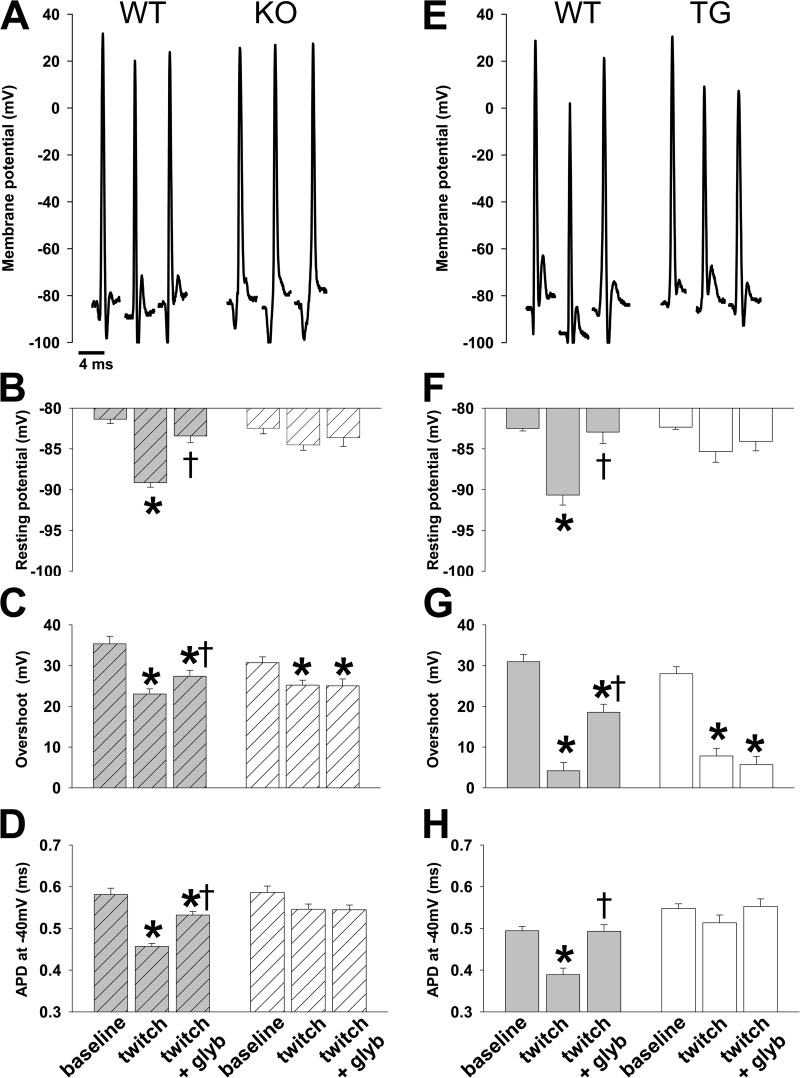
Figure 6.
Low-frequency isometric muscle twitches result in KATP channel activation with significant changes in resting and action potentials. Representative action potentials and summary statistics for action potential morphology in TA muscle in situ are shown for KO and TG with their respective WT controls under the conditions indicated along the bottom of the figure (baseline, twitch, and twitch + glyb [glyburide]) according to the protocol illustrated in Fig. 5. Summary statistics for WT (gray with stripes) and KO (open with stripes) are shown on the left (n = 32, 80, and 44 APs from n = 5, 4, and 4 mice and 48, 113, and 33 APs from 6, 5, and 4 mice, respectively; *, P < 0.05 vs. baseline and †, P < 0.05 vs. twitch using Student’s t test and Mann–Whitney rank sum test) and for WT (gray) and TG (open) on the right (n = 46, 20, and 30 APs from n = 9, 4, and 4 mice and 38, 26, and 32 APs from n = 11, 5, and 5 mice, respectively; *, P < 0.05 vs. baseline and †, P < 0.05 vs. twitch using Student’s t test and Mann–Whitney rank sum test) under their respective representative action potentials. (A–D) Shown for WT controls with KO are representative action potentials (A), resting potential (−81.4 ± 0.5 mV, −89.2 ± 0.5 mV, and −83.4 ± 0.8 mV for WT and −82.5 ± 0.7 mV, −84.5 ± 0.6 mV, and −83.6 ± 1.1 mV for KO; B), action potential overshoot (35.3 ± 1.9 mV, 23.0 ± 1.3 mV, and 27.4 ± 1.5 mV for WT and 30.7 ± 1.5 mV, 25.2 ± 1.2 mV, and 25.0 ± 1.7 mV for KO; C), and APD−40mV (0.58 ± 0.02 ms, 0.46 ± 0.01 ms, and 0.53 ± 0.01 ms for WT and 0.59 ± 0.02 ms, 0.55 ± 0.01 ms, and 0.55 ± 0.01 ms for KO; D). (E–H) Shown for WT controls with TG are representative action potentials (E), resting potential (−82.5 ± 0.3 mV, −90.7 ± 1.2 mV, and −82.9 ± 1.4 mV for WT and −82.3 ± 0.3 mV, −85.3 ± 1.3 mV, and −84.1 ± 1.2 mV for TG; F), action potential overshoot (31.0 ± 1.8 mV, 4.2 ± 2.0 mV, and 18.5 ± 2.0 mV for WT and 28.0 ± 1.7 mV, 7.8 ± 1.9 mV, and 5.7 ± 2.0 mV for TG; G), and APD−40mV (0.49 ± 0.01 ms, 0.39 ± 0.02 ms, and 0.49 ± 0.02 ms for WT and 0.55 ± 0.01 ms, 0.51 ± 0.02 ms, and 0.55 ± 0.02 ms for KO; H). Error bars indicate SEM.

