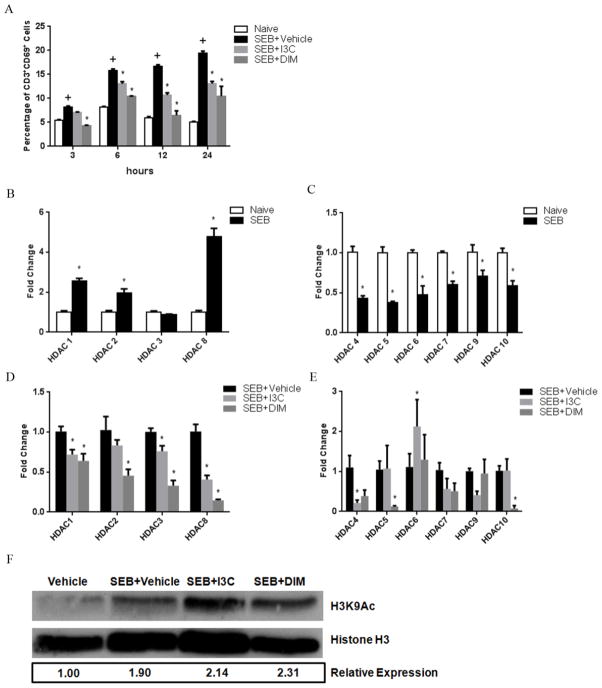
FIGURE 6. Effects of I3C and DIM on Class I and II HDACs in SEB-stimulated T cells.
Splenocytes were cultured in 96-well plates in the presence or absence of SEB (1ug/ml). Cultures also received I3C or DIM (100uM). The expression of CD69 on CD3+ was analyzed at various time points using antibody staining and flow cytometry among the experimental groups (A). After determining 6 hours was an appropriate time point to examine HDAC expression, RT-PCR was performed on samples. Samples consisted of RNA collected from PE-conjugated magnetic bead separated CD3+ T cell cultures for HDAC-I or HDAC-II. HDAC expression was compared between unstimulated and SEB-stimulated cultures for HDAC-I (B) and HDAC-II (C), followed by comparison between SEB-stimulated cultures to those treated with SEB+I3C or DIM for HDAC-I (D) and HDAC-II (E). Statistical significance (p-value <0.05) was determined using GraphPad Prism analysis software with one-way ANOVA and Tukey’s multiple comparison test (+ indicates significance compared to naive group, and * indicates significance compared to SEB+Vehicle). Western blot was performed for histone H3 and H3K9Ac in proteins isolated using RIPA buffer from CD3+ cells in all experimental groups (F). Numbers below the blots are relative expressons of H3K9 levels of experimental groups compared to vehicle group after normalization to histone H3 levels. Levels were determined using ImageJ software.

