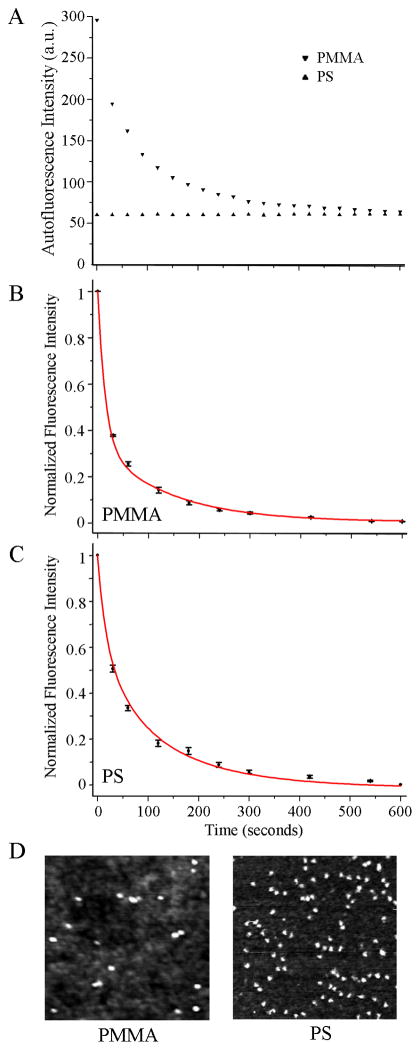
Figure 2.
Biomolecular fluorescence characteristics observed from the polymeric substrates of PMMA and PS. Black symbols and red lines correspond to the experimental data and curve fit, respectively. (A) The autofluorescence intensities from the polymeric substrates are profiled with respect to the exposure time, t. Both PMMA and PS show non-negligible autofluorescence where the original autofluorescence of PMMA is five times higher than that from PS. (B and C) Normalized, autofluorescence-subtracted fluorescence intensity from 200 μg/ml DTAF-antiIgG on PMMA (B) and on PS (C) is measured at constant illumination and plotted with respect to the exposure time. (D) 500 nm × 500 nm AFM topography panels showing the differences in the adsorbed IgG amount on the PMMA (left) and PS (right) platforms under the same biodeposition condition. Protein adsorption is favored on PS, showing higher amounts of IgG on PS.

