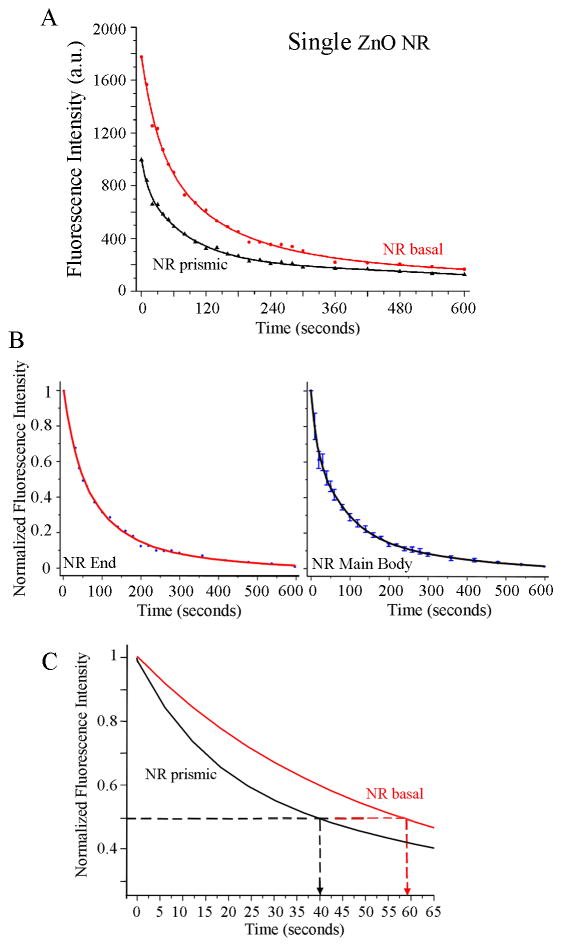
Figure 4.
Biomolecular fluorescence characteristics observed from 200 μg/ml DTAF-antiIgG on a single ZnO NR. Symbols and solid lines in each graph correspond to the experimental data and curve fits, respectively. (A) Differences in the time-dependence of the fluorescence intensity decay under constant irradiation are clearly observed depending on the crystallographic planes within a single ZnO NR. Red and black data show biomolecular fluorescence measured from the basal and prismic planes, respectively. When compared to the signal from the main body of the NR, fluorescence from the NR end is observed not only higher in intensity but also lasts for more prolonged time. (B) The plots show normalized fluorescence intensity profiles for the end (left) and the main body (right) of the ZnO NR, respectively. Each graph is produced by normalizing the two data sets in (A) with regard to the maximum and minimum intensity values of the respective set. (C) Early-time photostability trends of the biomolecular fluorescence measured from the NR basal (red) and the NR prismic (black) planes are displayed in this magnified view of the normalized intensity graphs in (B). Fluorescence signal from the basal plane persists much longer (T1/2 = 59 sec) than that from the prismic plane (T1/2 = 40 sec).

