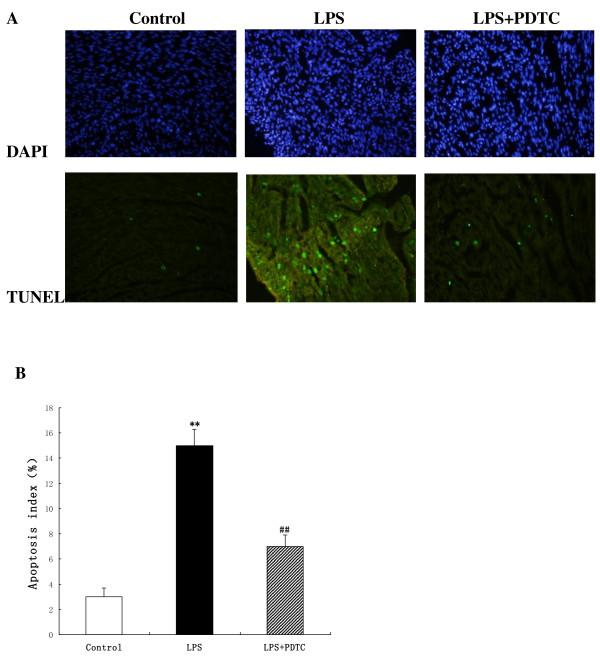
Figure 5.
TUNEL analysis in control, LPS and LPS + PDTC groups. (A) Nuclei are shown in blue after staining with DAPI. TUNEL-stained cells show green fluorescence in cells with single-stranded DNA breaks. (B) The apoptotic index analysis of the cardiomyocytes in the heart. **P < 0.05 vs. control group; ##P < 0.05 vs. LPS group.

