Figure 2.

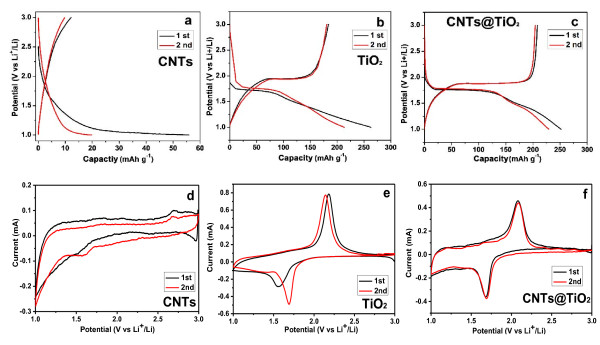
The first two charge/discharge profiles and CV curves. CNTs (a), TiO2 nanoparticles (b), and CNTs@TiO2(c) LIB anodes at a current density of 100 mA g-1. The initial two cyclic voltammograms of CNTs (d), TiO2(e), and CNTs@TiO2(f).

The first two charge/discharge profiles and CV curves. CNTs (a), TiO2 nanoparticles (b), and CNTs@TiO2(c) LIB anodes at a current density of 100 mA g-1. The initial two cyclic voltammograms of CNTs (d), TiO2(e), and CNTs@TiO2(f).