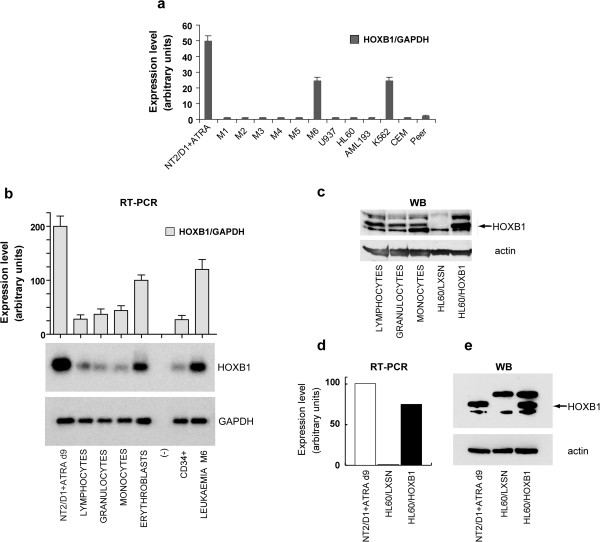
Figure 1.
HOXB1 expression analysis. Real time RT-PCR in a panel of leukemic cell lines (U937, HL60, AML193, K562, CEM, Peer) and in primary cells from patients staged from M1 to M6 AMLs (a). Representative RT-PCR in lymphocytes, granulocytes, monocytes, erythroblasts and CD34+ from normal peripheral blood, and in M6 erythroleukemia (b, bottom). The relative quantifications are reported as the ratio HOXB1/GAPDH (b, top). HOXB1 protein expression in normal peripheral blood cells compared to HL60/HOXB1 cells (c). Real time RT-PCR in LXSN- and HOXB1-transduced HL60 cell lines (d). Western blot analysis of HOXB1 (e); actin was used for normalization. NT2/D1 cells, treated with ATRA for 9 days, were utilized as positive controls.

