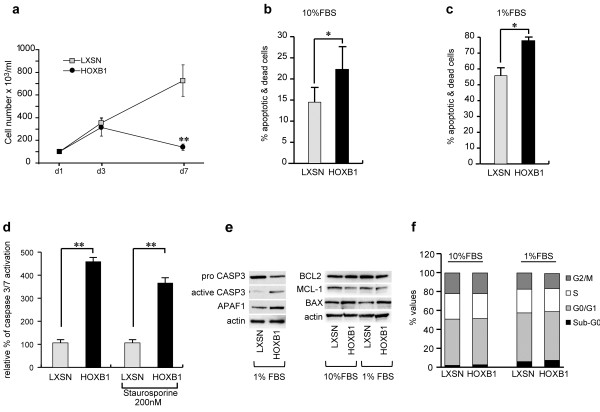
Figure 2.
Effects of HOXB1 restored expression in HL60 cell line. Analysis of cell growth (a) and percentage of apoptotic & dead cells, as evaluated at day 7 of culture by the Annexin/PI analysis system in 10% (b) and 1% (c) FBS, *p < 0.01. Activation of CASPASE 3/7 in LXSN- and HOXB1-transduced HL60 cells in low serum condition and in presence of 200 nM staurosporine in 10% FBS (d), **p <0.005. Western blot analysis of pro- and active CASPASE 3 and APAF1 (e left) and BCL-2, BAX and MCL1 proteins (e right). Actin was used for normalization. Cell cycle analysis in LXSN- and HOXB1-transduced HL60 cells (f).

