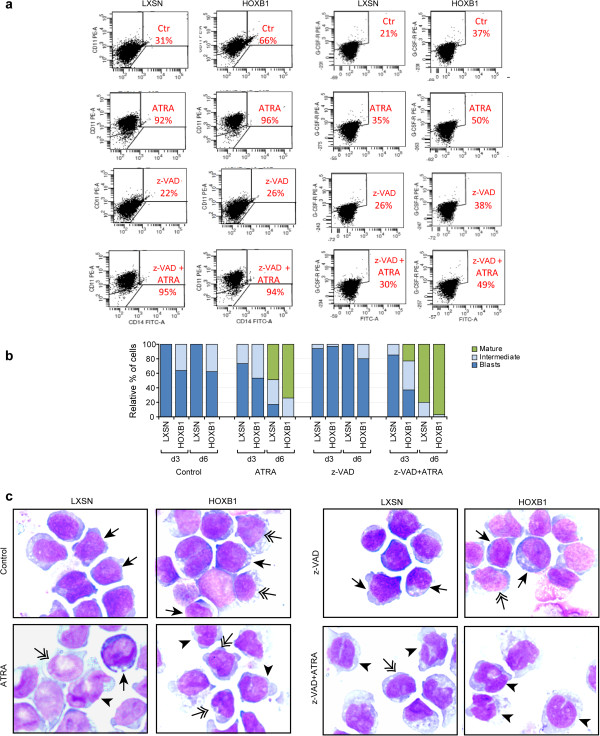
Figure 5.
Evaluation of ATRA-differentiation in presence of the apoptotic inhibitor z-VAD. Surface markers analysis of CD11b (at day 6) and G-CSFR (after 1 hr) in LXSN- and HOXB1-transduced HL60 cells in low serum and ATRA (10-7 M), z-VAD (25 μM) and z-VAD (25 μM) + ATRA (10-7 M) treatments (a). Morphological analysis (b) and representative pictures (c). Cells were detected by the Giemsa-McGrünwald colorimetric method. Arrowheads indicate mature cells, long arrows blasts and double arrows intermediate cells.

