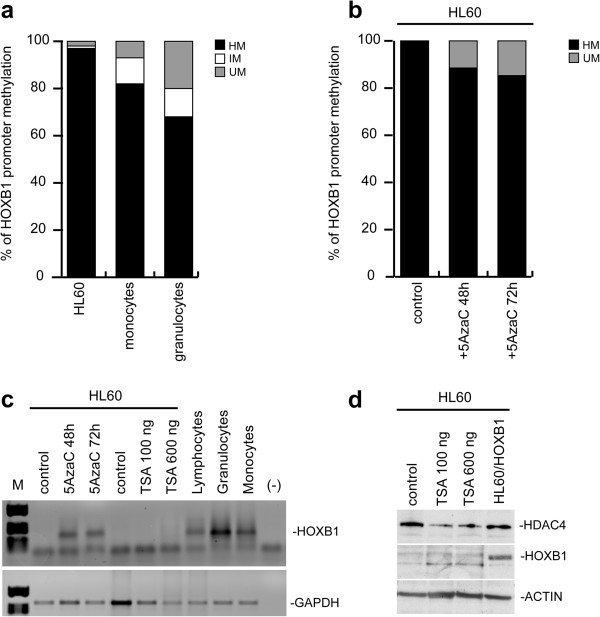
Figure 7.
HOXB1 promoter methylation in HL60 versus granulocytes and monocytes. Relative percentage of DNA hypermethylated (HM), not methylated (UM), and intermediate methylated (IM) fractions (a). HM and UM in 5-AzaC 1 μM treated HL60 cells after 48 h and 72 h (b). RT-PCR evaluation of HOXB1 in 5-AzaC- and TSA-treated HL60 cells compared with lymphocytes, granulocytes and monocytes (c). GAPDH is shown as quantitative standard. Western blotting of HDAC4 and HOXB1 in TSA-treated HL60 cells (d). Actin was used as quantitative standard.

