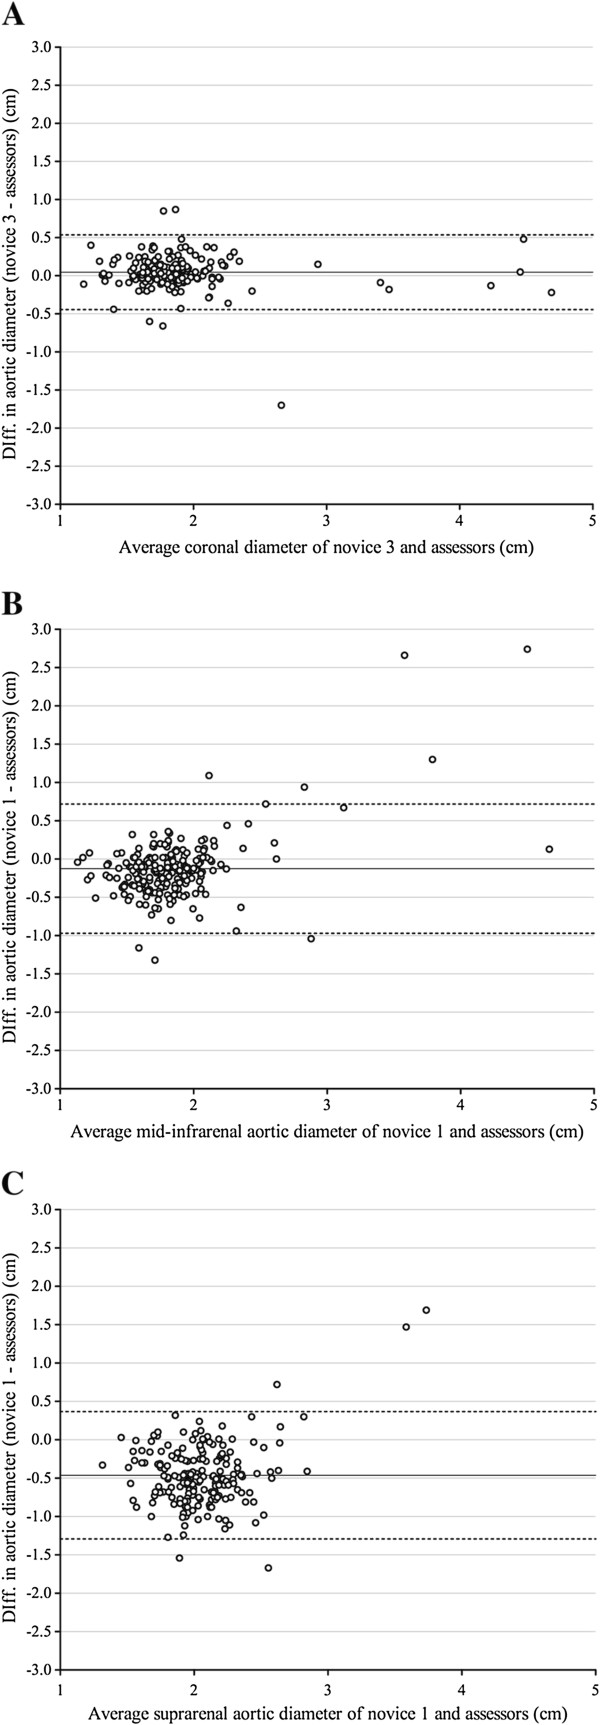
Figure 1.

Bland-Altman plots. Illustrating variations in performance. Bland-Altman graphs plot the inter-observer differences of the novice-assessors (y-axis) against the averages of those measurements. The dotted lines demarcate the limits of agreement (LOA), which should ideally lie within the clinically acceptable difference (CAD) of 0.5 cm. A demonstrates an acceptable performance by Novice 3 when measuring the maximal coronal diameter, with no measurement bias and the LOA within the CAD. B shows unacceptably high variability in Novice 1 measurements from mid-infrarenal aortic section with outliers in both normal and aneurysmal aorta. C shows a large under-sizing bias of 0.5 cm by Novice 1 when measuring the suprarenal segment of aortae, in addition the variability of measurement exceeded the CAD.
