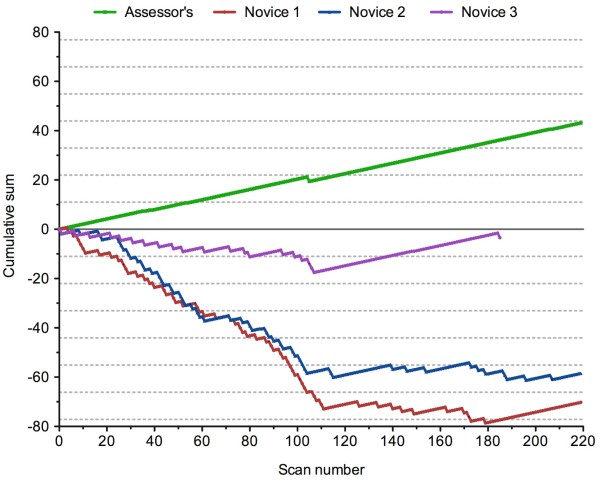
Figure 2.
Cusum plots demonstrating the progression in scanning efficiency for each novice over the study period. The mean and SD were calculated from a sample of 220 scans with a 90% success rate, using 10,000 iterations in the bootstrapping procedure. Limit lines (dotted grey lines) demarcate when the success rate becomes higher or lower than would be expected if due to chance with 97.5% certainty. The criterion for a success was any scan completed within 10 min and is charted as an increase of 0.21 on the chart. Failure, results in a decrease on the plot of -1.79. Assessors have a higher success rate than 90% and cross the upper boundary limits at scans 56, 118, 171; Novice scanners have lower success rate than expected: Novice 1 crosses lower limits at scans 22, 39, 59, 83, 97,104, 173; Novice 2 crosses lower limits at scans 30, 44, 58, 90, 103; Novice 3 crosses lower limits at scan 81. After scan 110 a plateau in performance occurs in the novices performances.

