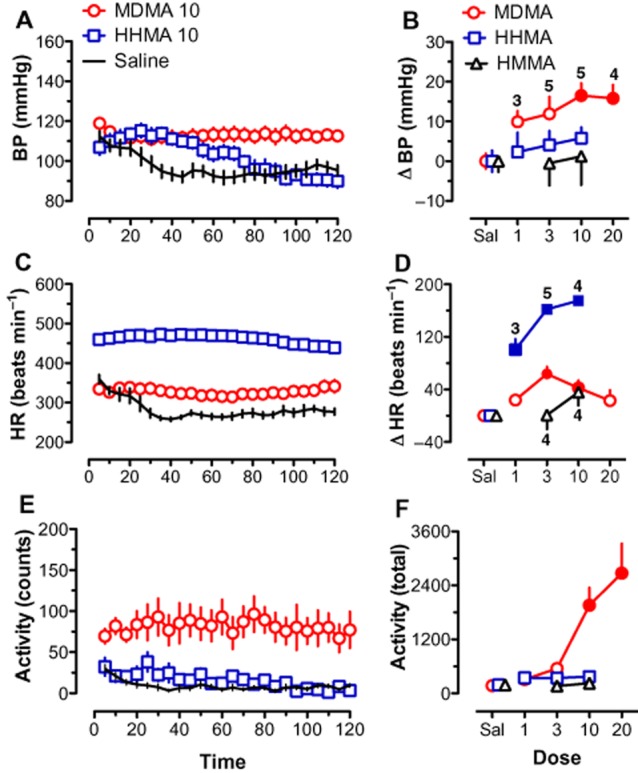
Figure 2.

Effects of MDMA, HHMA, HMMA and saline on BP (A, B), HR (C, D) and activity (E, F). Left-hand panels (A, C and E) depict time course data for a selected dose of MDMA (10 mg·kg−1) and HHMA (10 mg·kg−1) compared with saline. Each point represents mean ± SEM during a 5 min period. Right-hand panels (B, D and F) show the mean change scores (Δ) over the entire 120 min session for all doses tested. Change scores are compared with saline control. Filled symbols indicate significant difference (P < 0.05) with respect to saline-treated rats. Number of rats per dose is given for MDMA in (B) and for HHMA and HMMA in (D). Number of rats for saline for each drug is given in Table 1. Both MDMA and HHMA significantly increased HR. Only MDMA significantly increased BP and activity.
