
Figure 8.
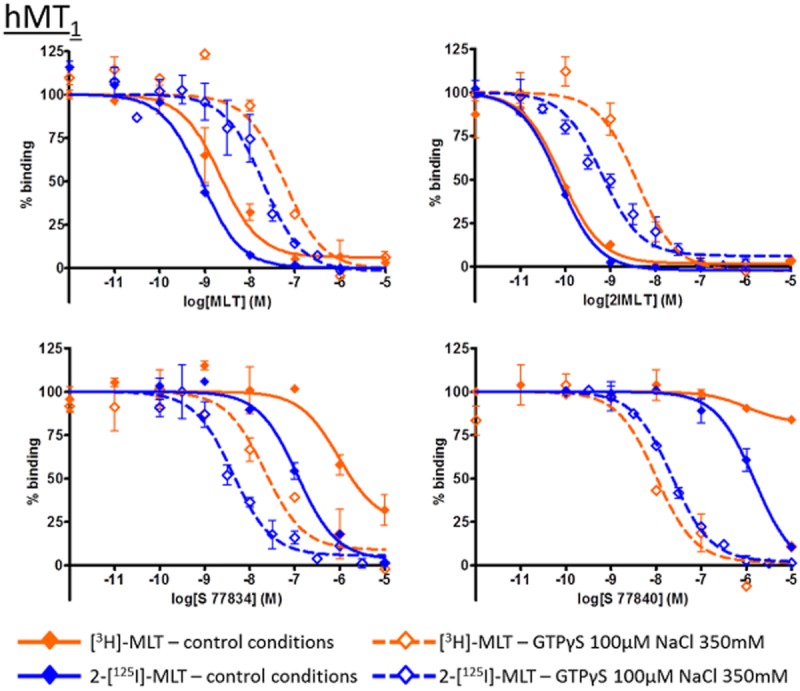
Inhibition curves for melatonin (MLT), 2-iodo-melatonin (2IMLT), S 77834 and S 77840 on hMT1 receptors with [3H]-MLT and 2-[125I]-MLT, in control condition or in presence of GTPγS 100 μM and NaCl 350 mM. Those individual IC50 curves are representative of experiments and illustrate the shift of IC50 values but not pKI in presence of GTPγS and NaCl. Please note that the IC50 values suggested by these figures are inherently different from the calculated pKI values given in the tables and in the text.