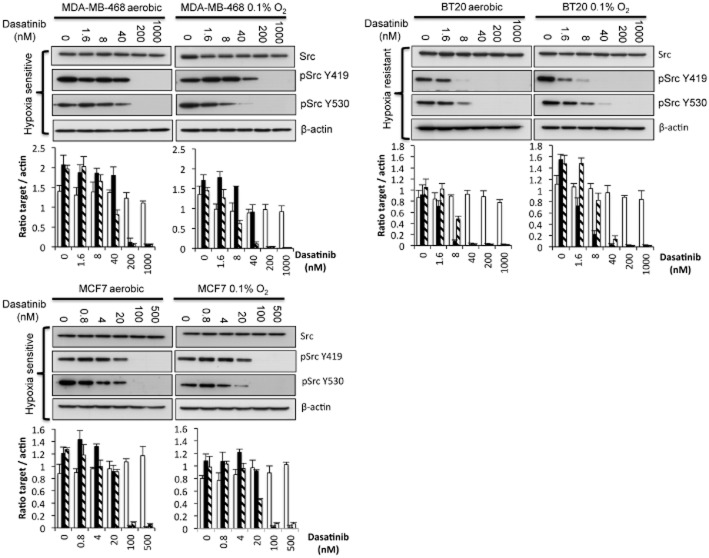
Figure 5.
Influence of hypoxia and dasatinib on Src and pSrc expression in a hypoxia-sensitive and resistant breast cancer cell lines. Western blot analysis of Src, pSrcY419 and pSrcY530 following the treatment of hypoxia-sensitive (MDA-MB-468 and MCF7) and resistant (BT20) cells with dasatinib for 24 h under aerobic and hypoxic conditions. Graphs show the quantification (±SD) of Src, pSrcY419 and pSrcY530 (key to shading of columns same as Figure 4) after normalization to β-actin for a minimum of n = 3 experiments.

