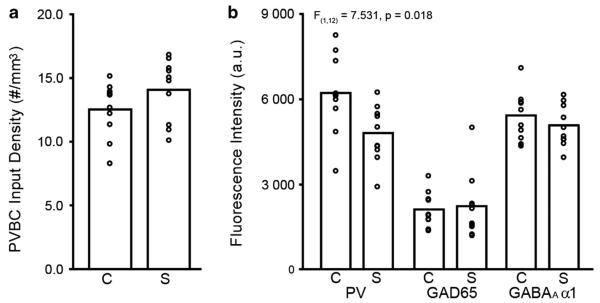
Figure 4.

Density and fluorescence intensities of parvalbumin basket cell (PVBC) inputs in schizophrenia (S) and healthy comparison (C) subjects. Bars indicate mean values for a diagnostic group, and open circles represent mean values for individual subjects. (a) Mean PVBC input density did not differ between groups. (b) Mean parvalbumin (PV) fluorescence intensity per PVBC bouton was significantly lower in schizophrenia subjects relative to healthy comparison subjects, but fluorescence intensity measures for GAD65 and GABAA receptor α1 subunit did not differ between groups. a.u., arbitrary unit.
