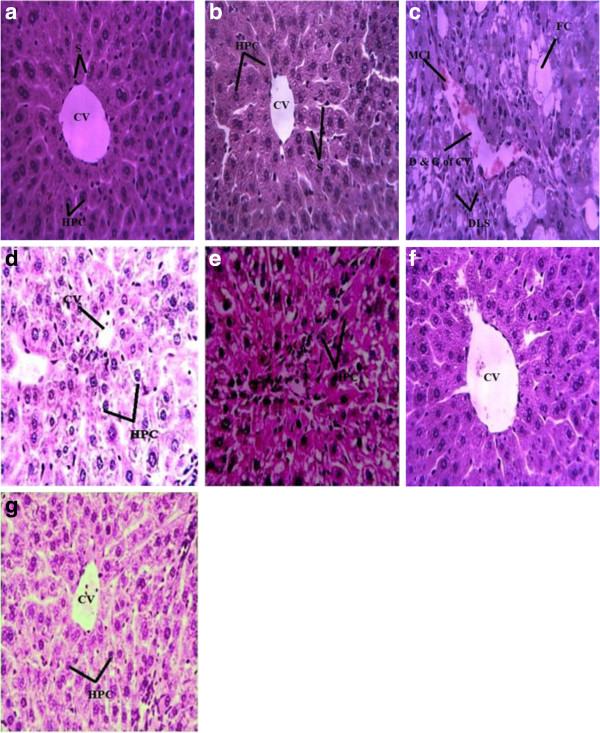
Figure 2.

Rat liver microscopic photograph (H & E stain).2a; Represents normal liver section, 2b; Vehicle control, 2c; CCl4 treated control, 2d; CCl4+silymerin treated, 2e; CCl4 +SCEE 150 mg/kg treated, 2f; CCl4+SCEE 300 mg/kg treated 2g; only SCEE 300 mg/kg treated. CV (Central vein), S (Sinusoids) and HPC (Hepatocytes). DLS (Degeneration of lobular shape), FC (Fatty change), and D& C (Dilation and congestion of central vein).
