Fig. 3.
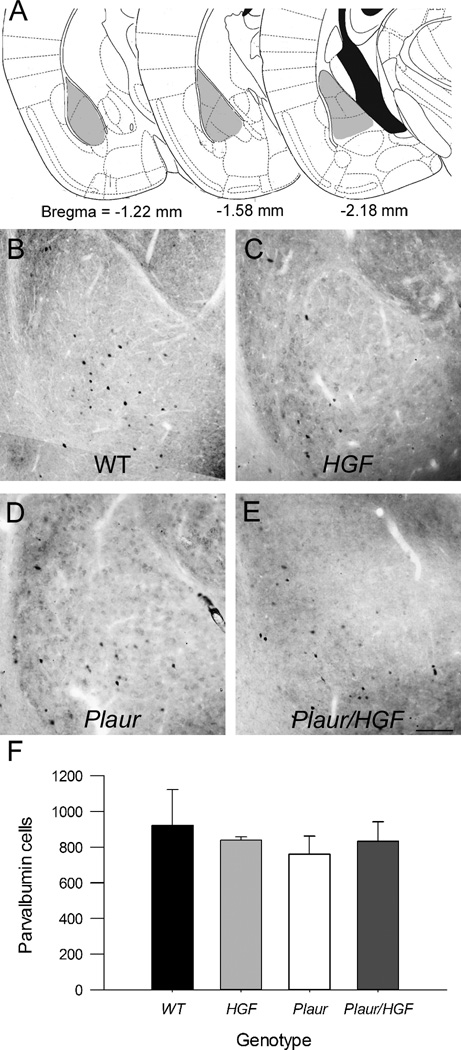
PV+ cells in the BLA are not affected by changes in Plaur or HGF. (a) Diagrams of counted regions. Gray shaded areas denote counting regions. Figures are adapted from Paxinos and Watson [31]. (b–d) Immunohistochemistry of PV+ cells in BLA of adult WT (b), HGF (c), Plaur (d), and Plaur/HGF mice (e). Bar = 150 µm. (f) The numbers of PV+ cells were stereologically estimated in the BLA. Each bar represents n ≥ 3 mice, with error bars denoting the SEM.

