Figure 3.
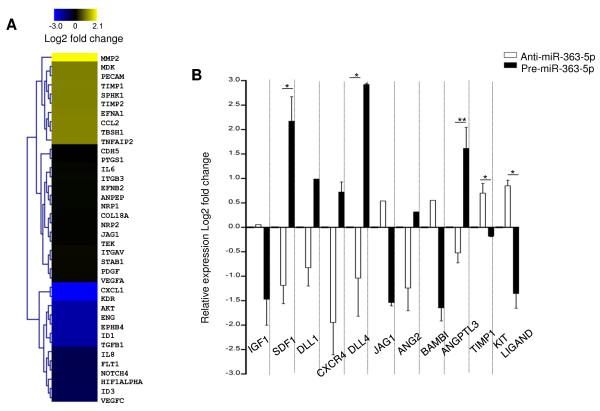
Modulation of angiogenic and angiocrine genes by miR-363-5p. (A) Expression profile of angiogenesis-related genes of EC with reduced level of miR-363-5p using pre-made PCR arrays. Unsupervised average linkage hierarchical clustering (Euclidean distance) was performed. The color display encodes the log2 of the expression changes normalized to scramble control, where varying shades of yellow and blue indicate up and down regulation, respectively. (B) Expression levels (log2 fold change) of angiocrine genes in endothelial cells having reduced or high levels of miR-363-5p compared to scramble control. Error bars represent s.e.m. of normalized expression mean. * P ≤ 0.05 ** P ≤ 0.01 by Student’s t test.

