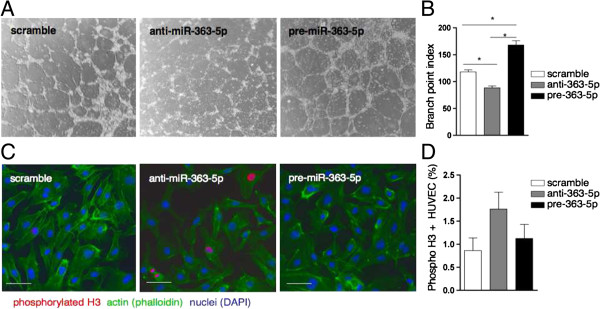
Figure 7.

Effect of miR-363-5p levels in EC properties. (A) Tube formation assay to measure angiogenesis activity in HUVEC 48 h post-transfection with anti-miR-363-5p, pre-miR-363-5p and scramble control. Representative phase contrast (20X magnification) and (B) quantification by branch point index. Data are means ± s.e.m. of the two replicates from two independent experiments. * P ≤ 0.05 by Student’s test. (C) Proliferation assessed by positive staining for phosphorylated histone H3 (red) 48 h post-transfection with anti-miR-363-5p, pre-miR-363-5p and scramble control. Actin cytoskeleton was stained with phalloidin (green), nuclei, DAPI (blue). Scale bars, 10 μm. (D) Quantification represents the average ± s.e.m. of three independent transfection experiments.
