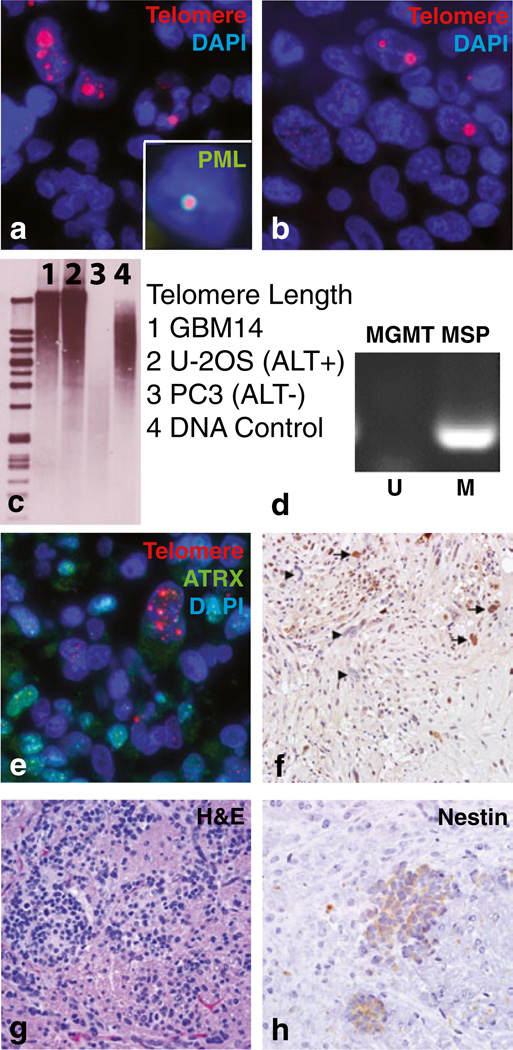
Fig. 1.
ALT characterization in a glioblastoma neurosphere line. a Telomere-specific FISH analysis in JHH-GBM14 and b primary tumor, as well as concurrent telomere FISH and PML immunofluorescence (inset in a). c Highly heterogeneous telomere length distribution typical of ALT was seen by Southern blot analysis in JHH-GBM14 and U-2 OS ALT(+) cells, while ALT(−) PC3 cells lacked this distribution. d MGMT promoter analysis via methylation-specific PCR. e JHH-GBM14 cells showing loss of ATRX protein demonstrate the ALT phenotype. f Primary tumor, arrows: ATRX positive; arrowheads: ATRX negative tumor cells. g JHH-GBM14 intracranial xenografts, H&E. h Human-specific nestin immunohistochemistry

