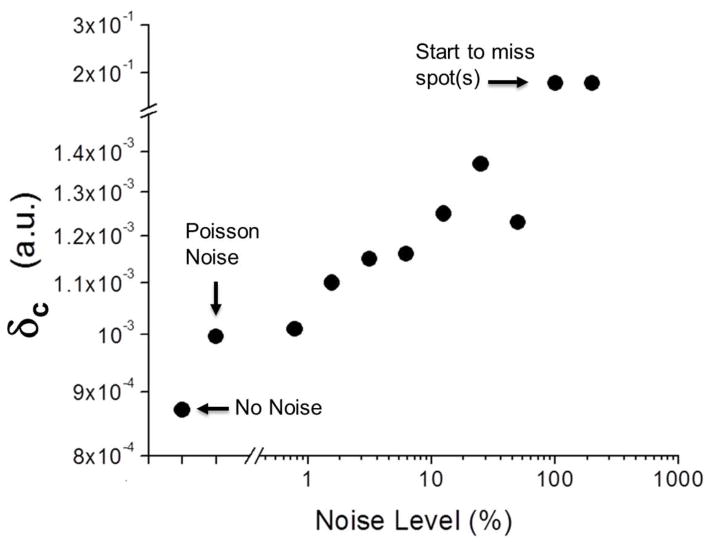
Figure 4.
Deviation of detected locations of quantum dots from their actual positions in the presence of Gaussian noises at various levels (defined by the ratio of N to the photon number from a single quantum dot). The deviation is defined as
, where rd and ra are the detected and actual locations of a quantum dot and rd = ∞ for a missing quantum dot. Gaussian noises were chosen to respect the nature of photon noise (i.e. Poisson noise) because it can be often modeled using a Gaussian distribution,
 (μ = N, σ2 = N), whose variance depends on the expected photon count (N). QDB3 can faithfully localize all the quantum dots correctly, up to noise level of ~ 100%. When the noise level is above ~ 100%, QDB3 started to fail detection of some quantum dots (≤ 2 out of ~ 10 quantum dots at noise level 200%).

